jetBlue Results Presentation Deck
POSITIONING FOR LONG-TERM FINANCIAL STRENGTH
●
●
4Q 2021 EARNINGS
jetBlue
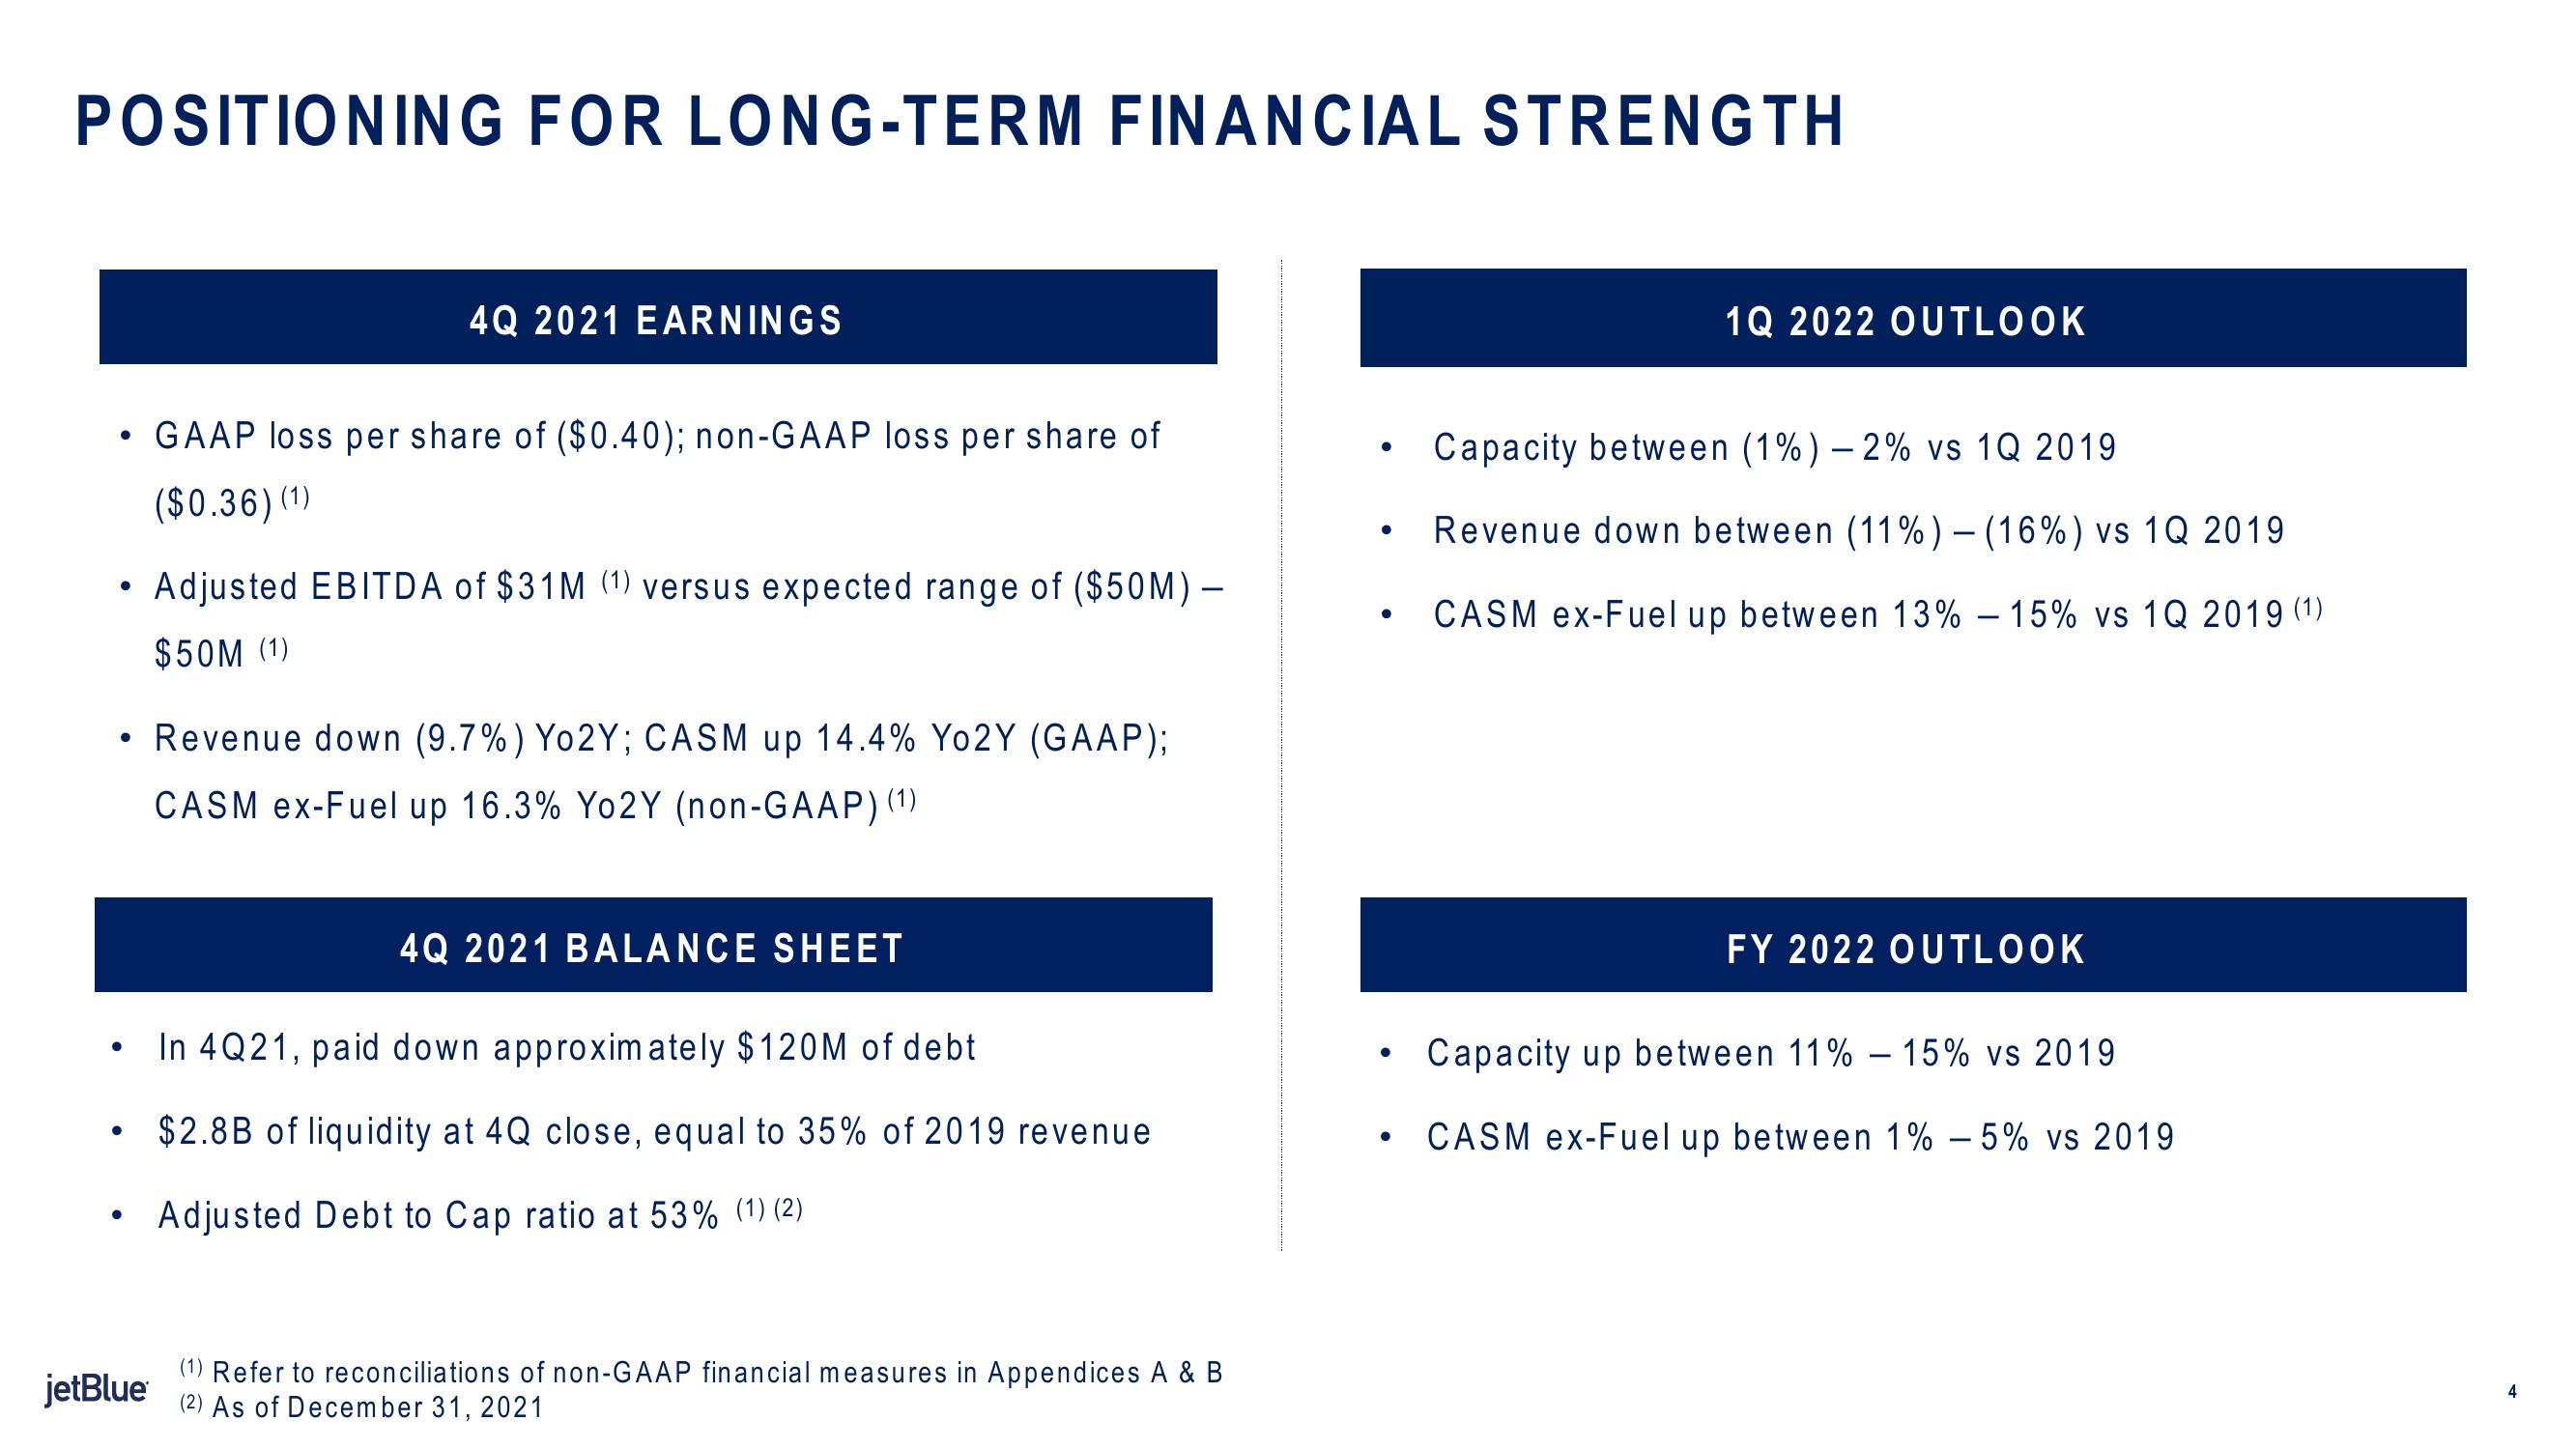
GAAP loss per share of ($0.40); non-GAAP loss per share of
($0.36) (1)
• Revenue down (9.7%) Yo2Y; CASM up 14.4% Yo2Y (GAAP);
CASM ex-Fuel up 16.3% Yo2Y (non-GAAP) (1)
Adjusted EBITDA of $31M (1) versus expected range of ($50M) -
$50M (1)
4Q 2021 BALANCE SHEET
In 4Q21, paid down approximately $120M of debt
$2.8B of liquidity at 4Q close, equal to 35% of 2019 revenue
Adjusted Debt to Cap ratio at 53% (1) (2)
(1) Refer to reconciliations of non-GAAP financial measures in Appendices A & B
(2) As of December 31, 2021
●
●
●
●
●
1Q 2022 OUTLOOK
Capacity between (1%) -2% vs 1Q 2019
Revenue down between (11%) - (16%) vs 1Q 2019
CASM ex-Fuel up between 13% - 15% vs 1Q 2019 (1)
FY 2022 OUTLOOK
Capacity up between 11% -15% vs 2019
CASM ex-Fuel up between 1% 5% vs 2019
4View entire presentation