Enfusion Results Presentation Deck
Reconciliations To Non-GAAP Financial Measures
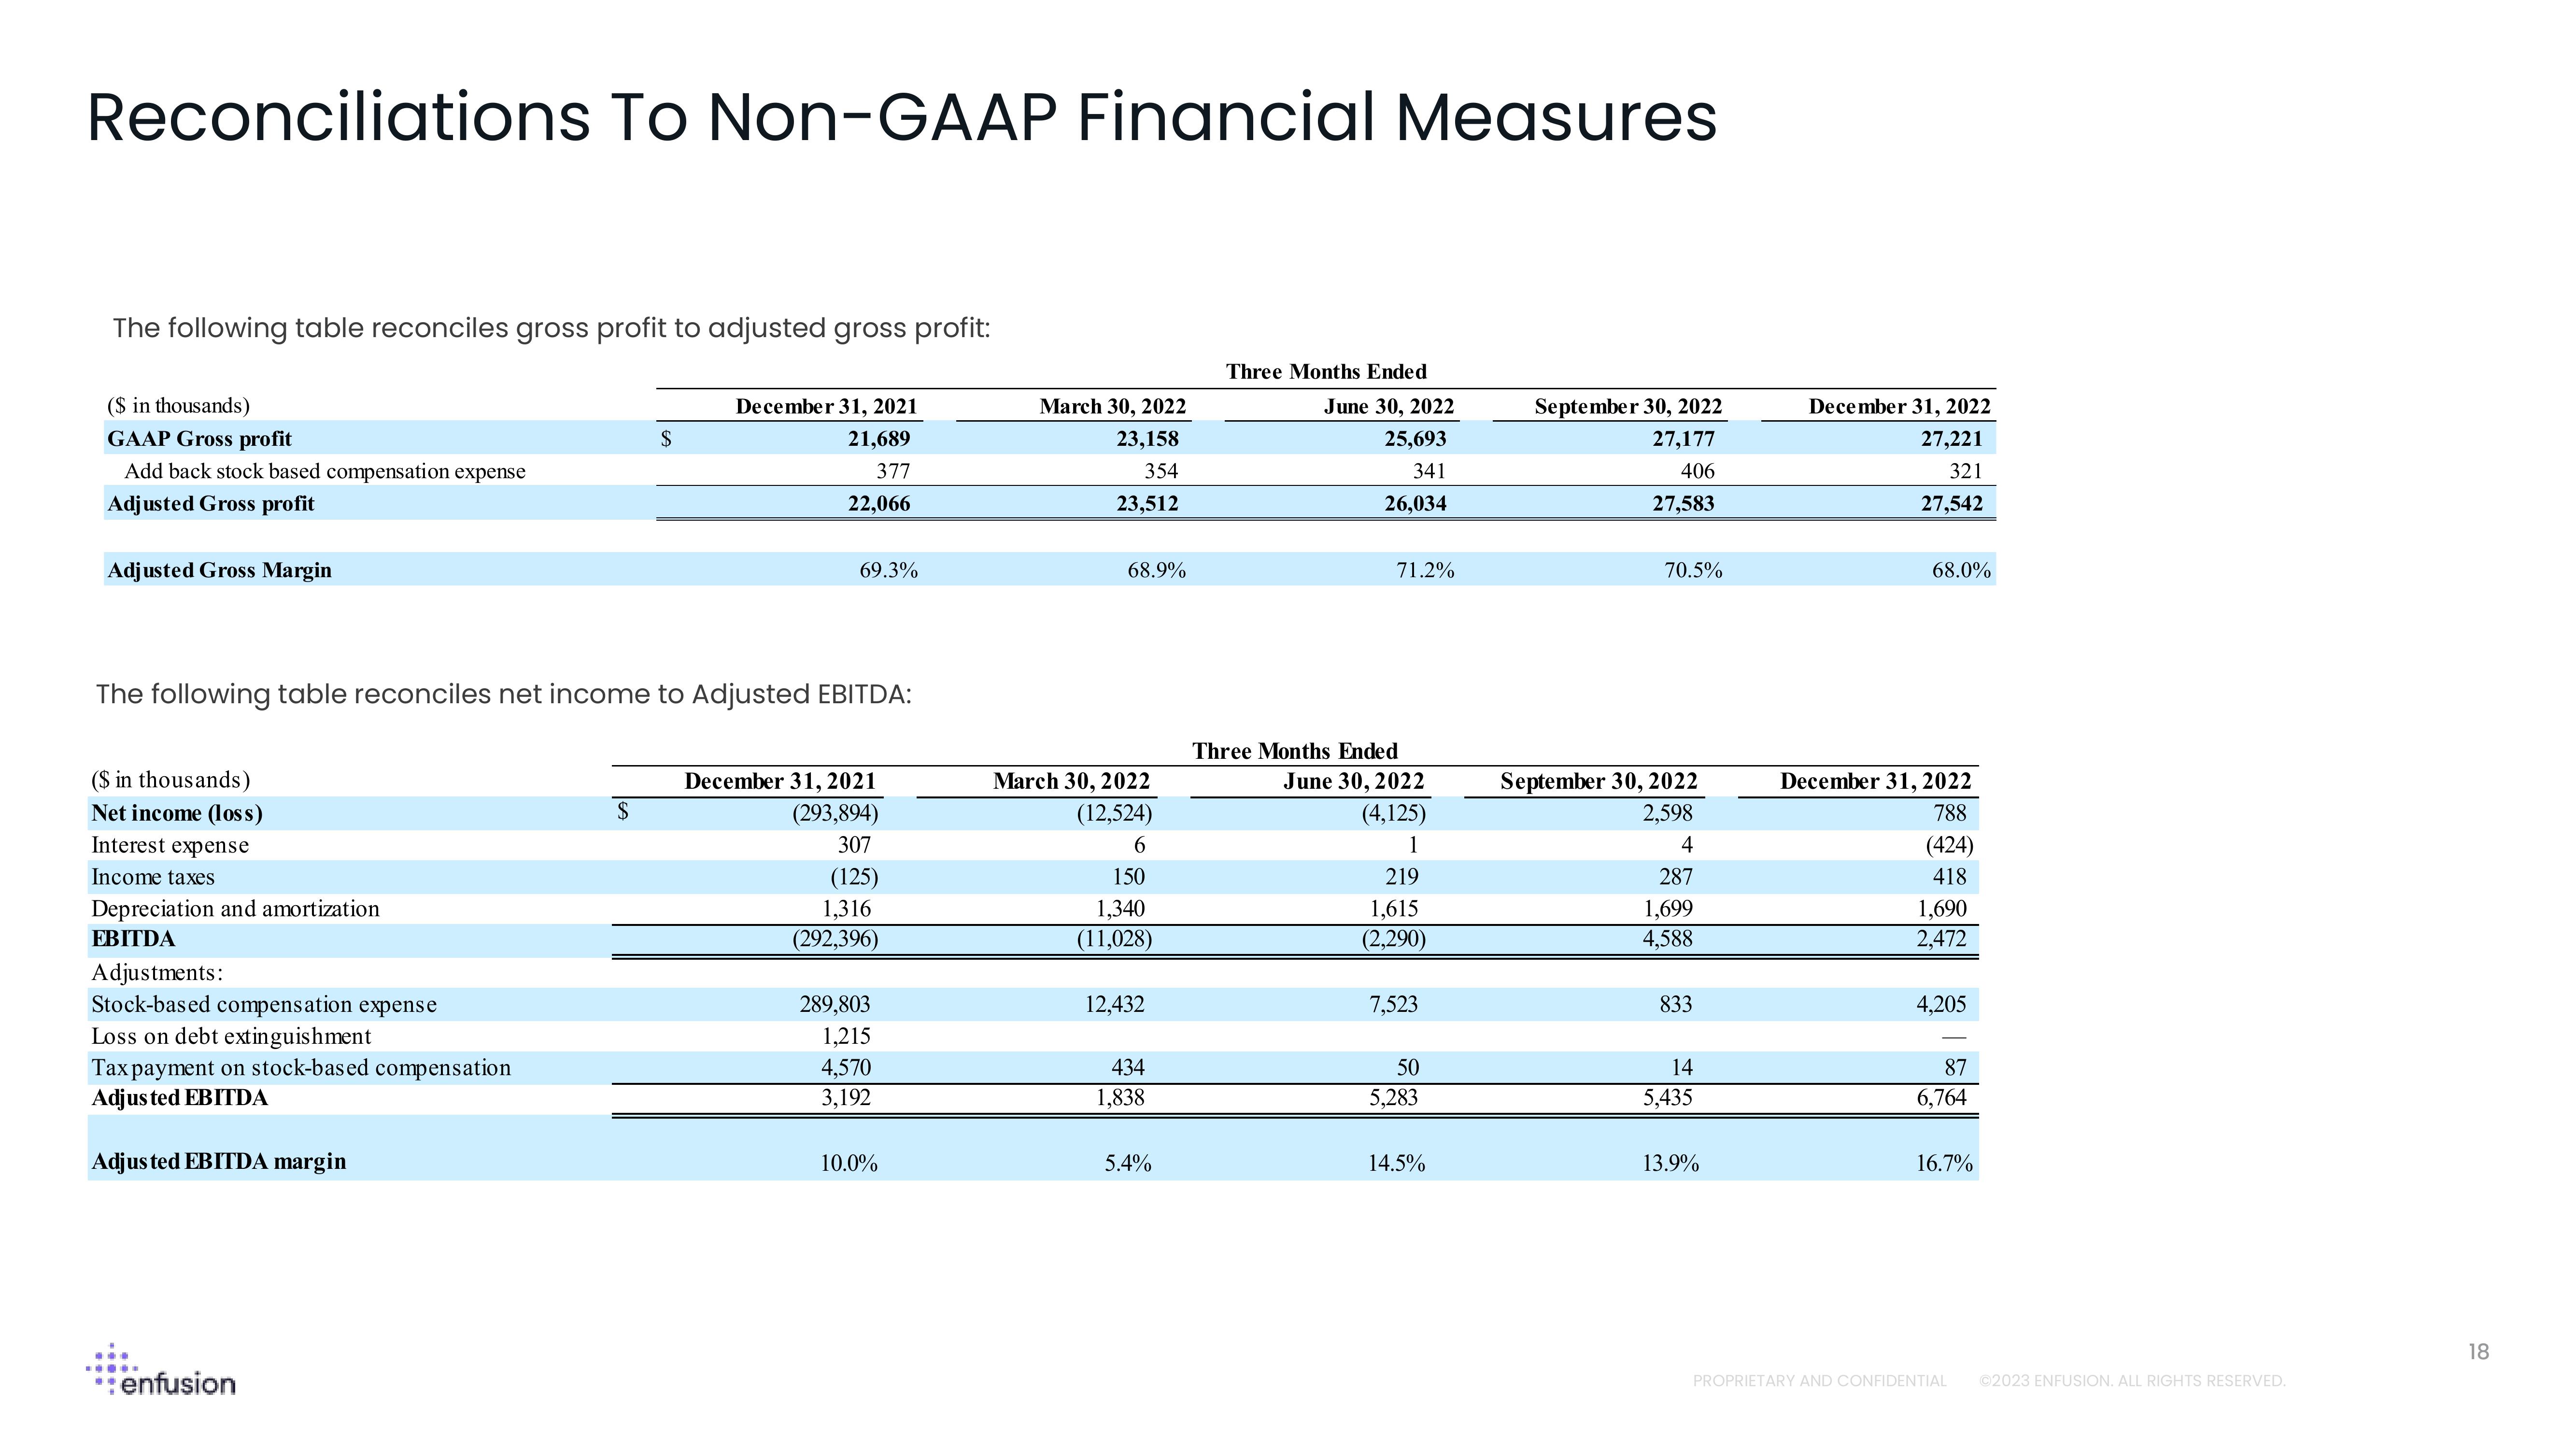
The following table reconciles gross profit to adjusted gross profit:
($ in thousands)
GAAP Gross profit
Add back stock based compensation expense
Adjusted Gross profit
Adjusted Gross Margin
($ in thousands)
Net income (loss)
Interest expense
Income taxes
The following table reconciles net income to Adjusted EBITDA:
Depreciation and amortization
EBITDA
Adjustments:
Stock-based compensation expense
Loss on debt extinguishment
Taxpayment on stock-based compensation
Adjusted EBITDA
Adjusted EBITDA margin
*:enfusion
$
$
December 31, 2021
21,689
377
22,066
69.3%
December 31, 2021
(293,894)
307
(125)
1,316
(292,396)
289,803
1,215
4,570
3,192
10.0%
March 30, 2022
23,158
354
23,512
68.9%
March 30, 2022
(12,524)
6
150
1,340
(11,028)
12,432
434
1,838
5.4%
Three Months Ended
June 30, 2022
25,693
341
26,034
71.2%
Three Months Ended
June 30, 2022
(4,125)
1
219
1,615
(2,290)
7,523
50
5,283
14.5%
September 30, 2022
27,177
406
27,583
70.5%
September 30, 2022
2,598
4
287
1,699
4,588
833
14
5,435
13.9%
December 31, 2022
27,221
321
27,542
68.0%
December 31, 2022
788
(424)
418
1,690
2,472
4,205
87
6,764
16.7%
PROPRIETARY AND CONFIDENTIAL
Ⓒ2023 ENFUSION. ALL RIGHTS RESERVED.
18View entire presentation