Kore SPAC Presentation Deck
Pro forma financial summary
(US$ in millions)
CaaS
% Growth
IoT Solutions
% Growth
One Time Churn
Total Revenue
% Total Growth
(-) COGS
Total Gross Profit
% Gross Margin
(-) SG&A¹
Adj. EBITDA
% Adj. EBITDA Margin
Total Capex
Unlevered FCF²
Cum. FCF
Historicals Prelim.
2019A
2020P
$125
9%
47
20 %
33
$ 206
3%
(82)
$ 123
60 %
(66)
$ 57
28 %
$ 137
9%
55
16 %
22
$ 214
4%
(98)
$ 116
54 %
(59)
$ 57
26%
2021P³
$ 144
5%
59
8%
15
$ 219
2%
(94)
$ 125
57 %
(65)
$ 60
27%
(12)
$ 32
32
2022P³
$ 163
13 %
70
17%
5
$ 238
9%
(102)
$ 136
57 %
(69)
$ 67
28 %
(12)
$ 42
75
Forecast
2023P
$187
15%
89
28%
$ 276
16 %
(117)
$ 158
57 %
(77)
$ 82
30 %
(12)
$ 60
135
2024P
$213
14%
120
35 %
$ 333
21 %
(140)
$ 193
58 %
(86)
$ 107
32 %
(13)
$ 91
226
2025P
$246
15 %
168
40 %
$ 414
24 %
(172)
$ 242
58 %
(101)
$ 140
34 %
(13)
$ 123
349
CAGR
¹21P-¹25P
14%
30 %
17%
18 %
24 %
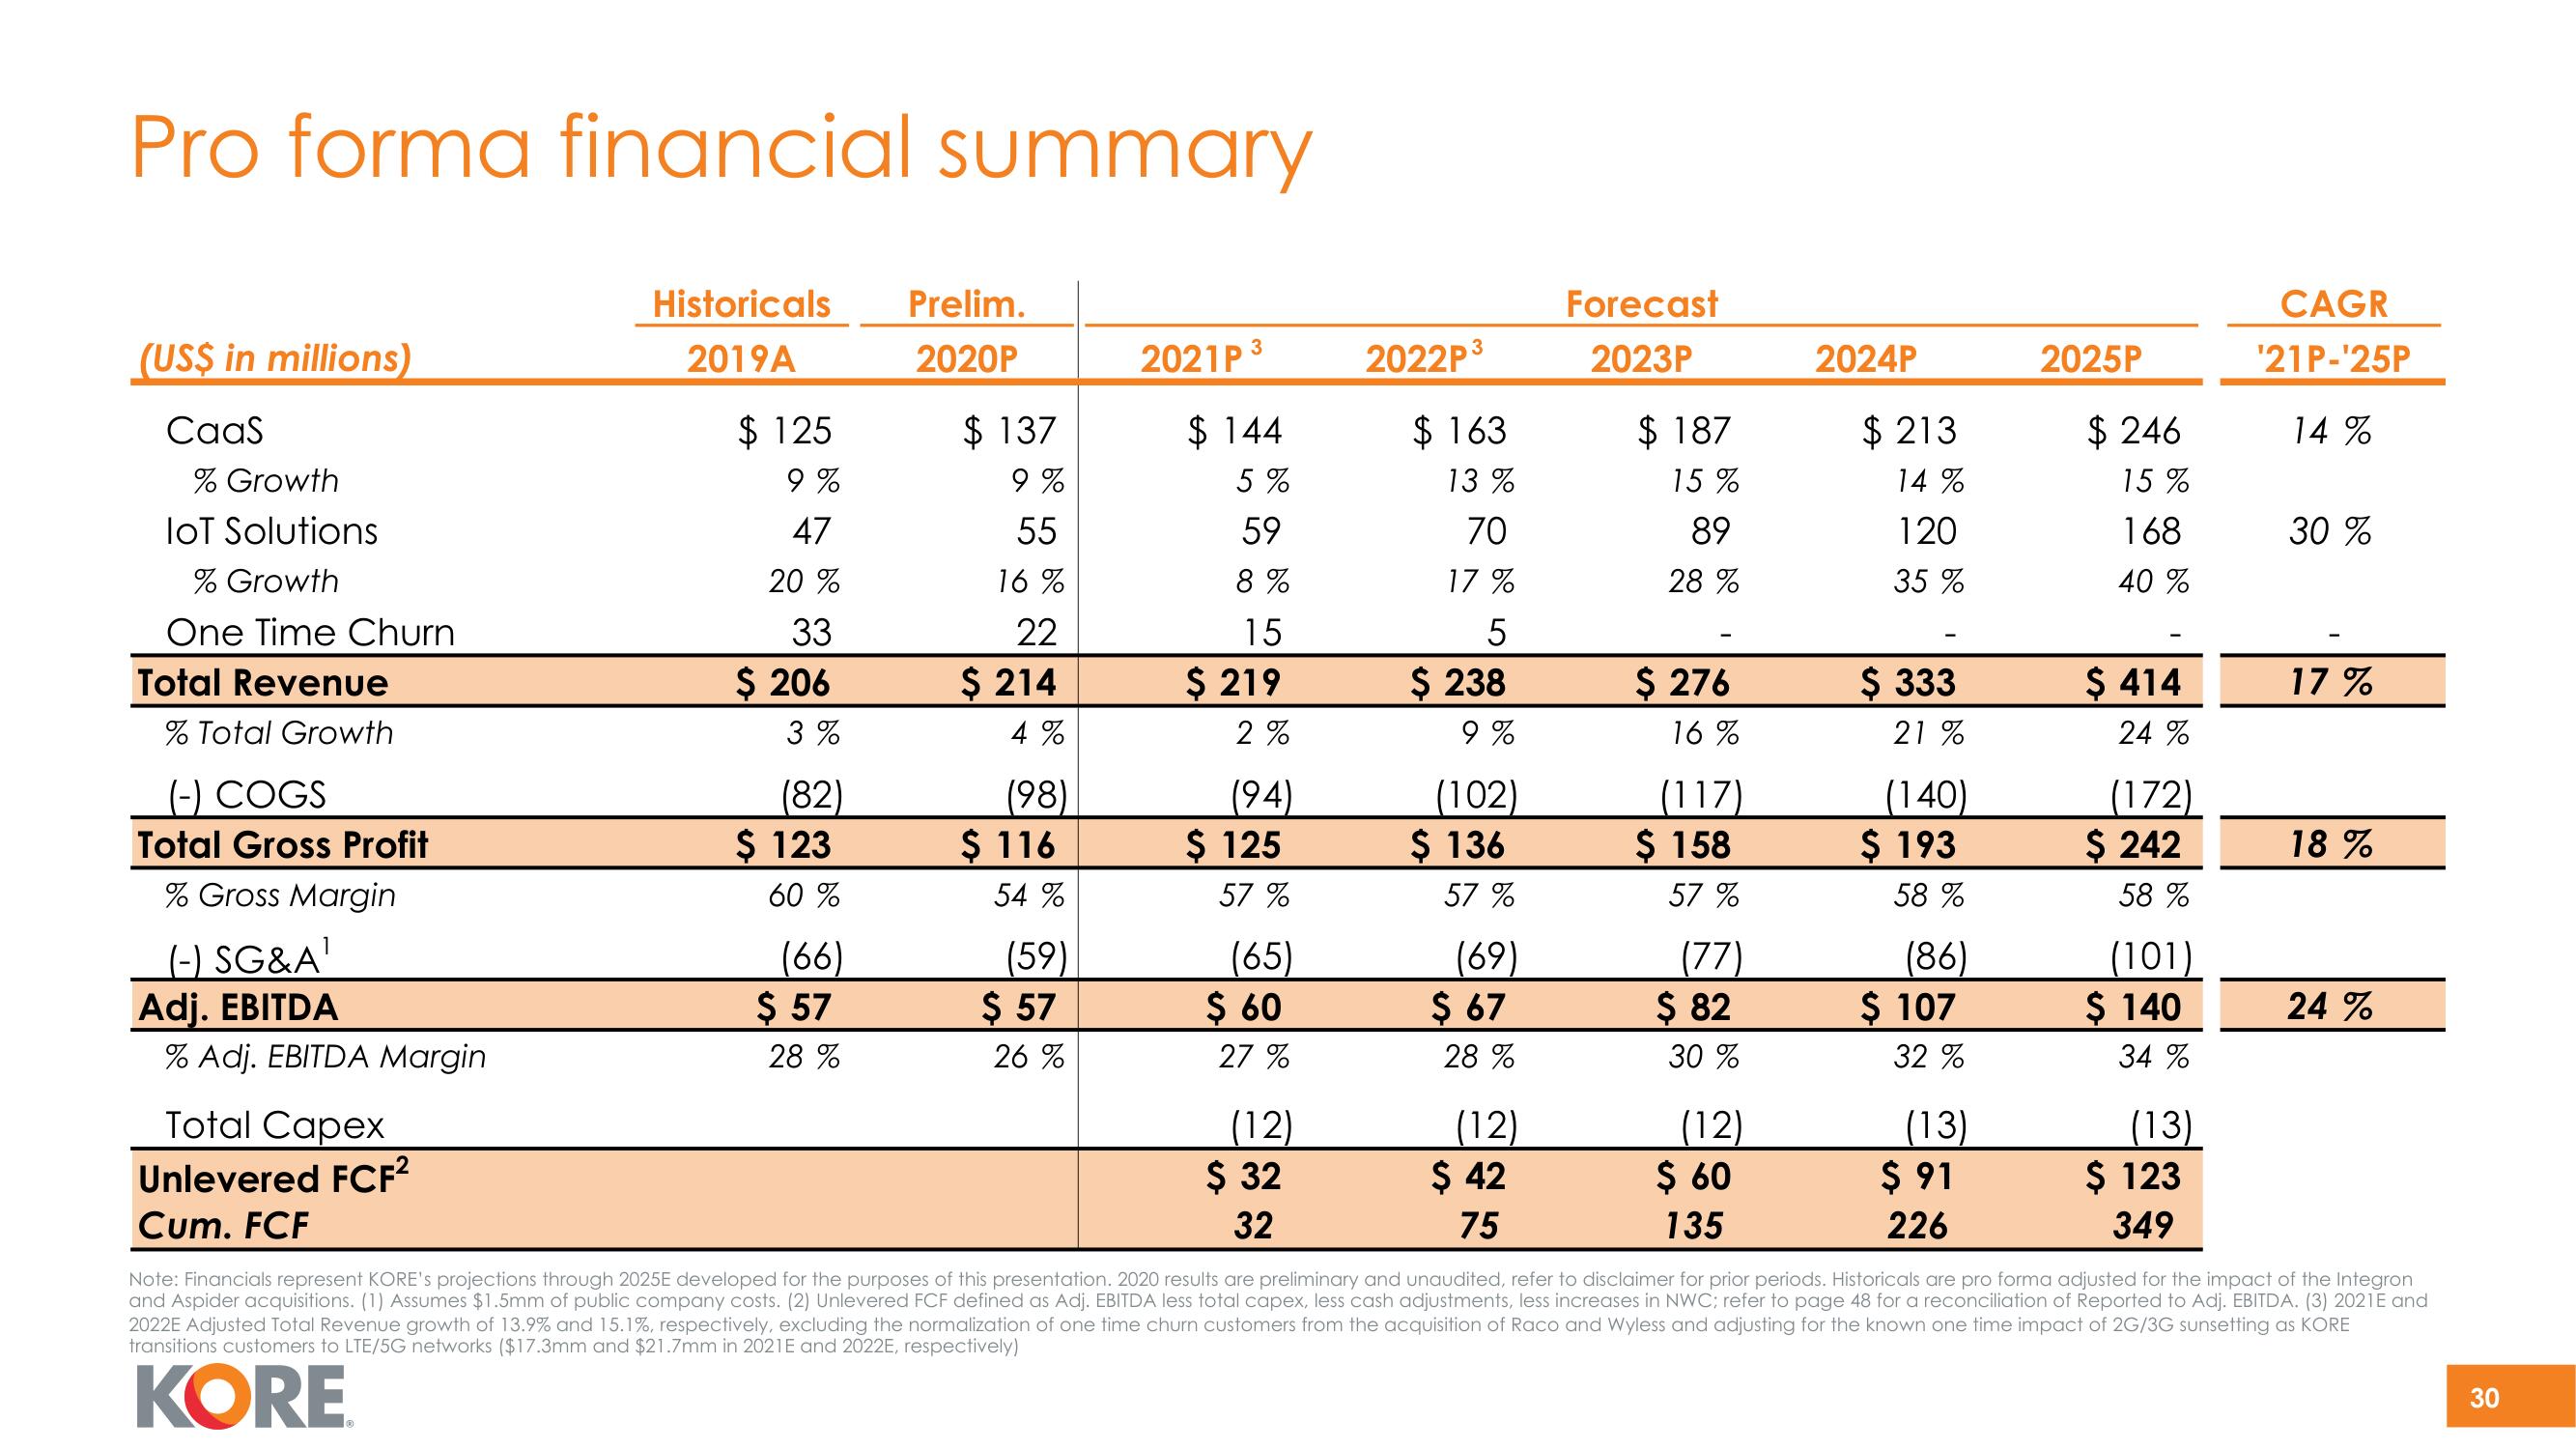
Note: Financials represent KORE's projections through 2025E developed for the purposes of this presentation. 2020 results are preliminary and unaudited, refer to disclaimer for prior periods. Historicals are pro forma adjusted for the impact of the Integron
and Aspider acquisitions. (1) Assumes $1.5mm of public company costs. (2) Unlevered FCF defined as Adj. EBITDA less total capex, less cash adjustments, less increases in NWC; refer to page 48 for a reconciliation of Reported to Adj. EBITDA. (3) 2021E and
2022E Adjusted Total Revenue growth of 13.9% and 15.1%, respectively, excluding the normalization of one time churn customers from the acquisition of Raco and Wyless and adjusting for the known one time impact of 2G/3G sunsetting as KORE
transitions customers to LTE/5G networks ($17.3mm and $21.7mm in 2021E and 2022E, respectively)
KORE
30View entire presentation