Telia Company Results Presentation Deck
Cash CAPEX
14
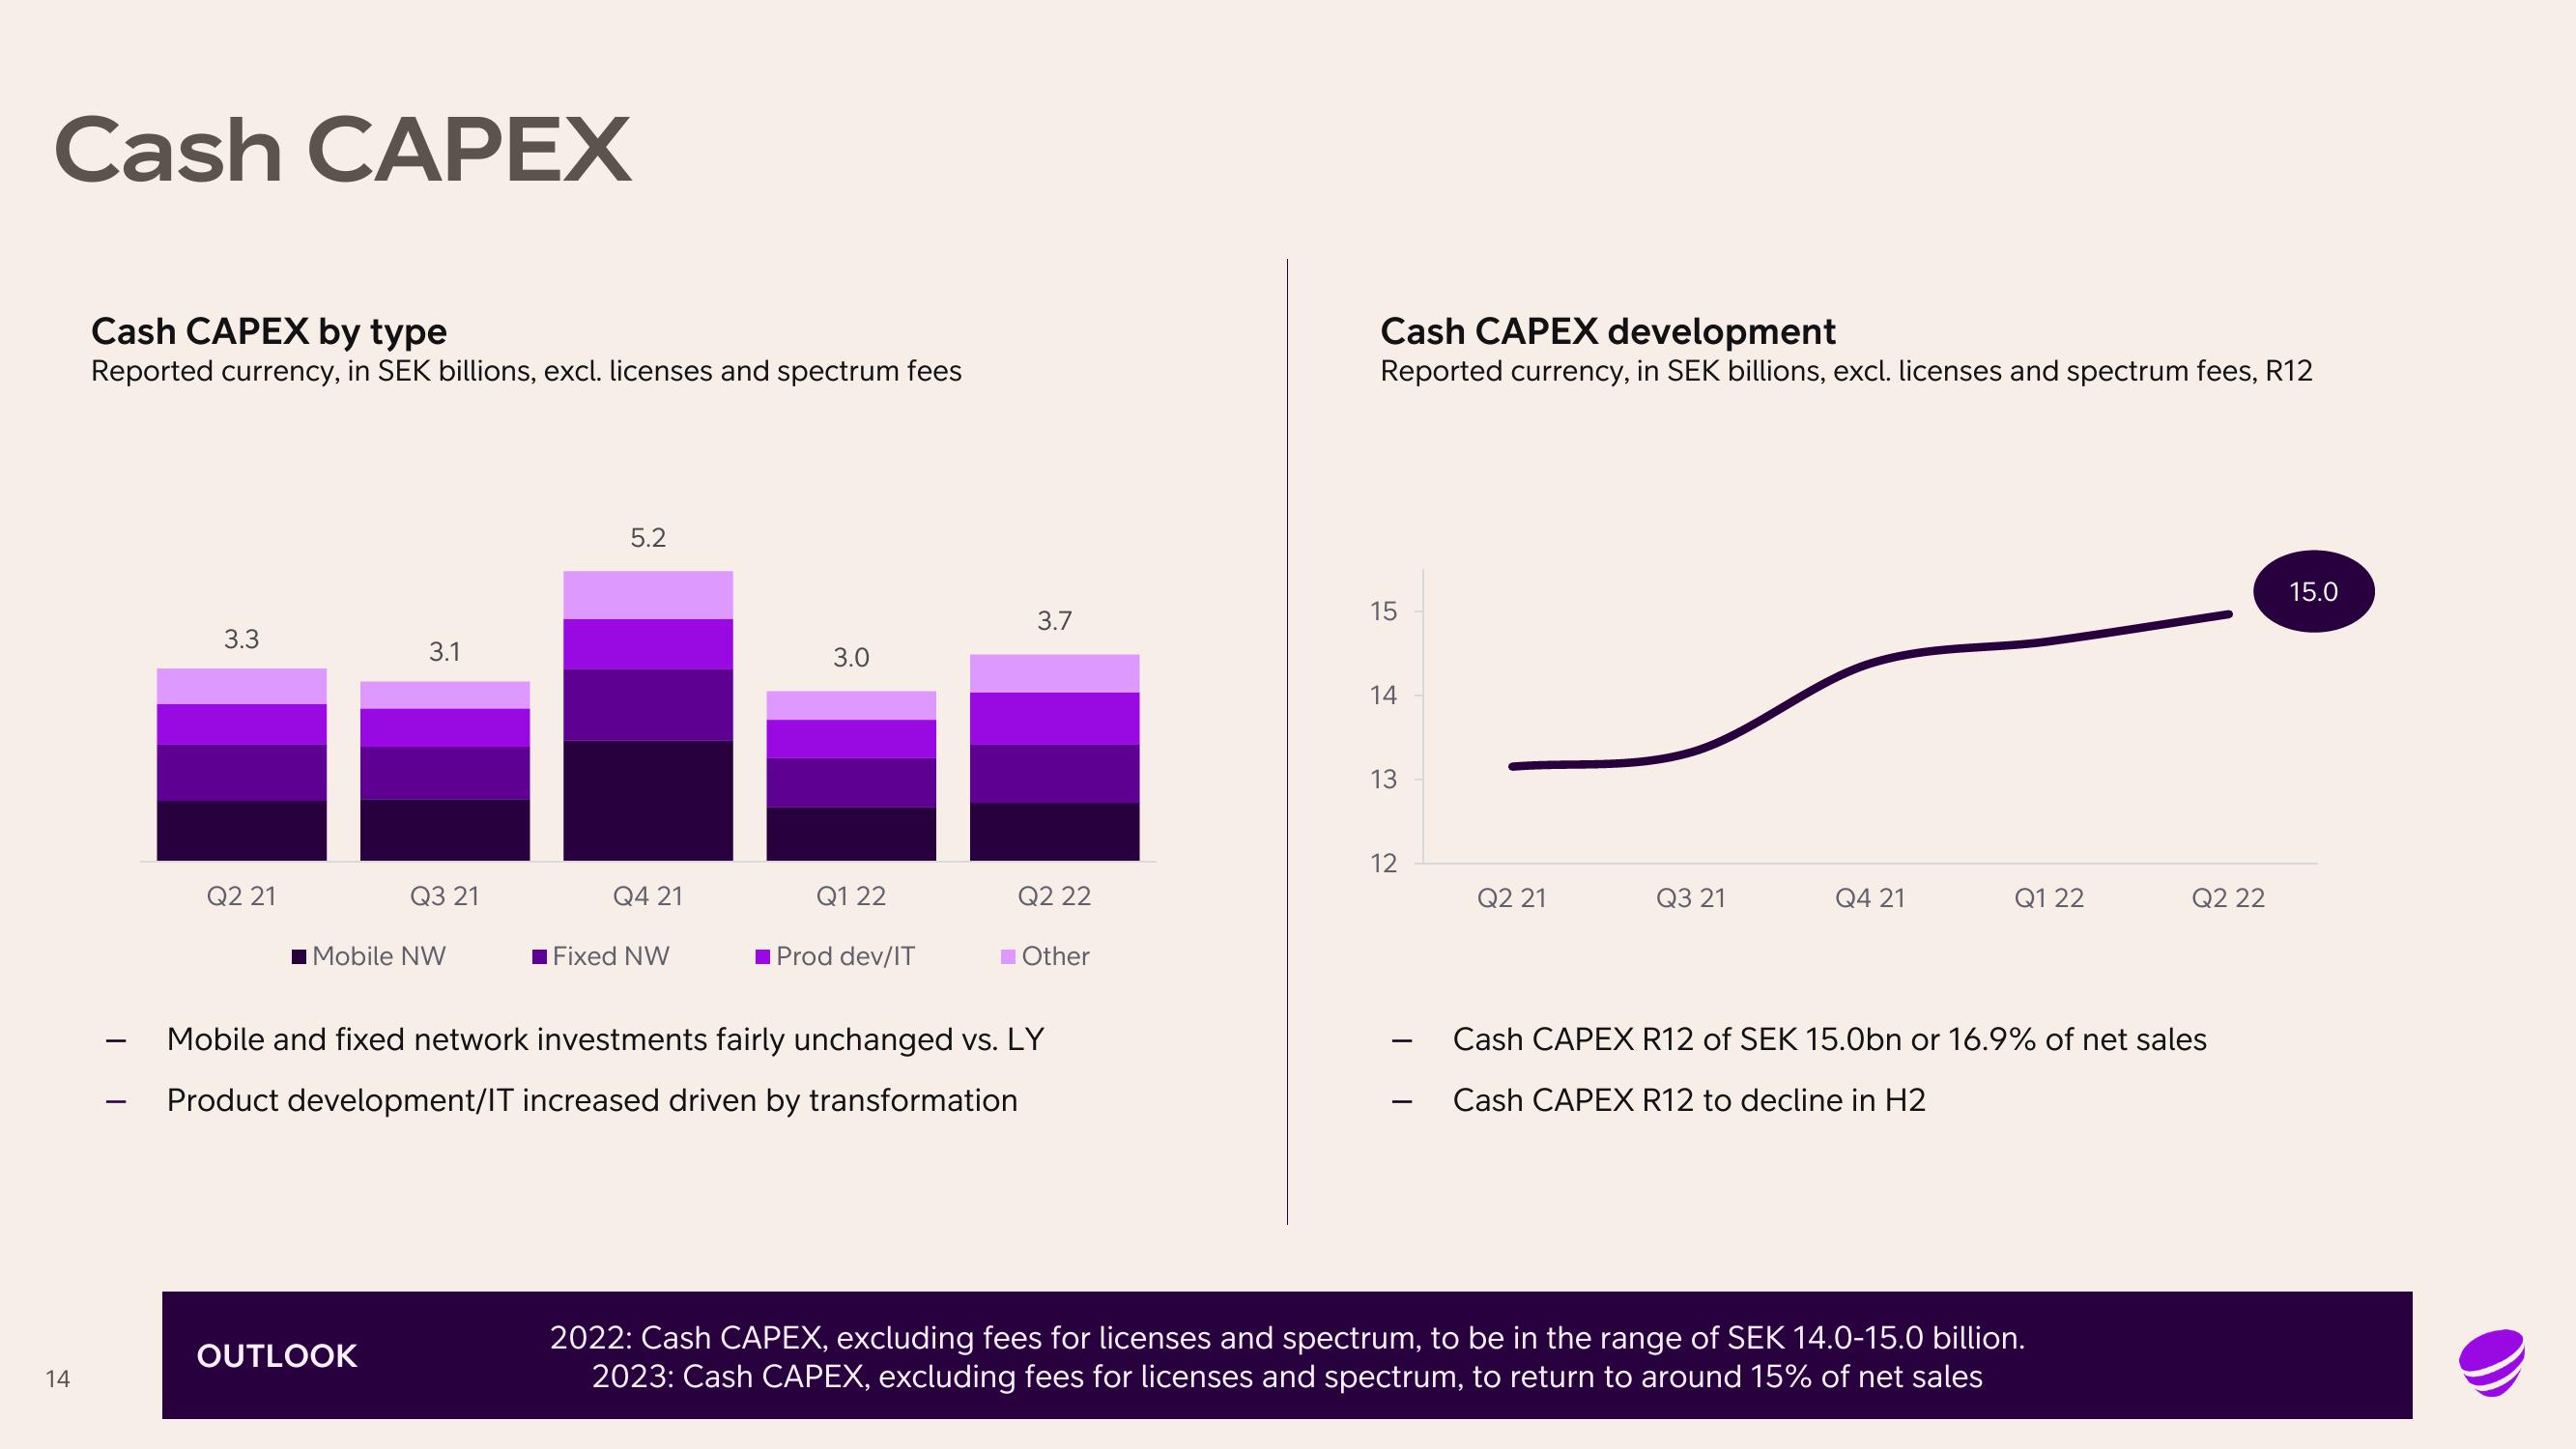
Cash CAPEX by type
Reported currency, in SEK billions, excl. licenses and spectrum fees
-
3.3
Q2 21
3.1
Q3 21
Mobile NW
OUTLOOK
5.2
Q4 21
Fixed NW
3.0
Q1 22
■Prod dev/IT
3.7
Q2 22
Other
Mobile and fixed network investments fairly unchanged vs. LY
Product development/IT increased driven by transformation
Cash CAPEX development
Reported currency, in SEK billions, excl. licenses and spectrum fees, R12
15
14
13
12
-
Q2 21
Q3 21
Q4 21
Q1 22
Q2 22
Cash CAPEX R12 of SEK 15.0bn or 16.9% of net sales
Cash CAPEX R12 to decline in H2
2022: Cash CAPEX, excluding fees for licenses and spectrum, to be in the range of SEK 14.0-15.0 billion.
2023: Cash CAPEX, excluding fees for licenses and spectrum, to return to around 15% of net sales
15.0View entire presentation