OppFi Results Presentation Deck
Balance Sheet Highlights
($ in 000s)
Assets
Cash and restricted cash
Finance Receivables at Fair
Value
Finance Receivables at
Amortized Cost, Net
Other Assets
Total Assets
Unaudited
9/30/2021
$56,802
334,114
1,269
48,469
$440,654
Liabilities and Stockholders'/Members' Equity
Other Liabilities
$51,976
Total Debt
225,759
Warrant Liability
24,506
Total Liabilities
$302,241
Total Equity
138,413
Total Liabilities and Equity
$440,654
12/31/2020
$45,657
222,243
17,943
$285,843
$28,406
158,105
$186,511
99,332
$285,843
■
•
·
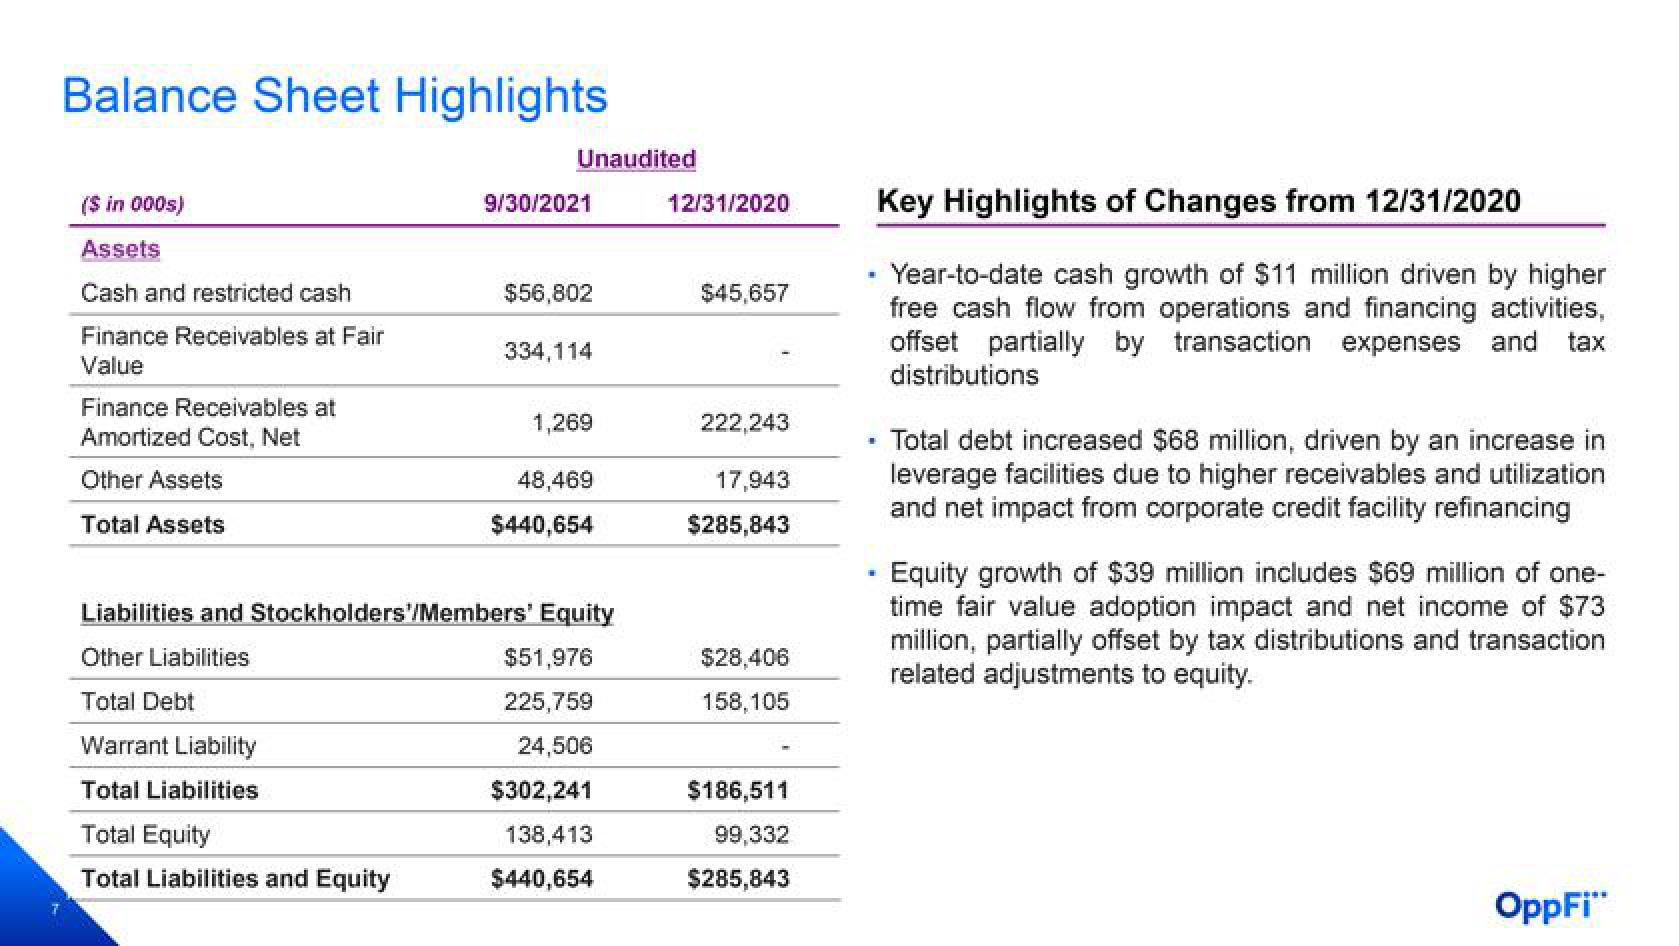
Key Highlights of Changes from 12/31/2020
Year-to-date cash growth of $11 million driven by higher
free cash flow from operations and financing activities,
offset partially by transaction expenses and tax
distributions
Total debt increased $68 million, driven by an increase in
leverage facilities due to higher receivables and utilization
and net impact from corporate credit facility refinancing
Equity growth of $39 million includes $69 million of one-
time fair value adoption impact and net income of $73
million, partially offset by tax distributions and transaction
related adjustments to equity.
OppFi"View entire presentation