Goldman Sachs Results Presentation Deck
Platform Solutions
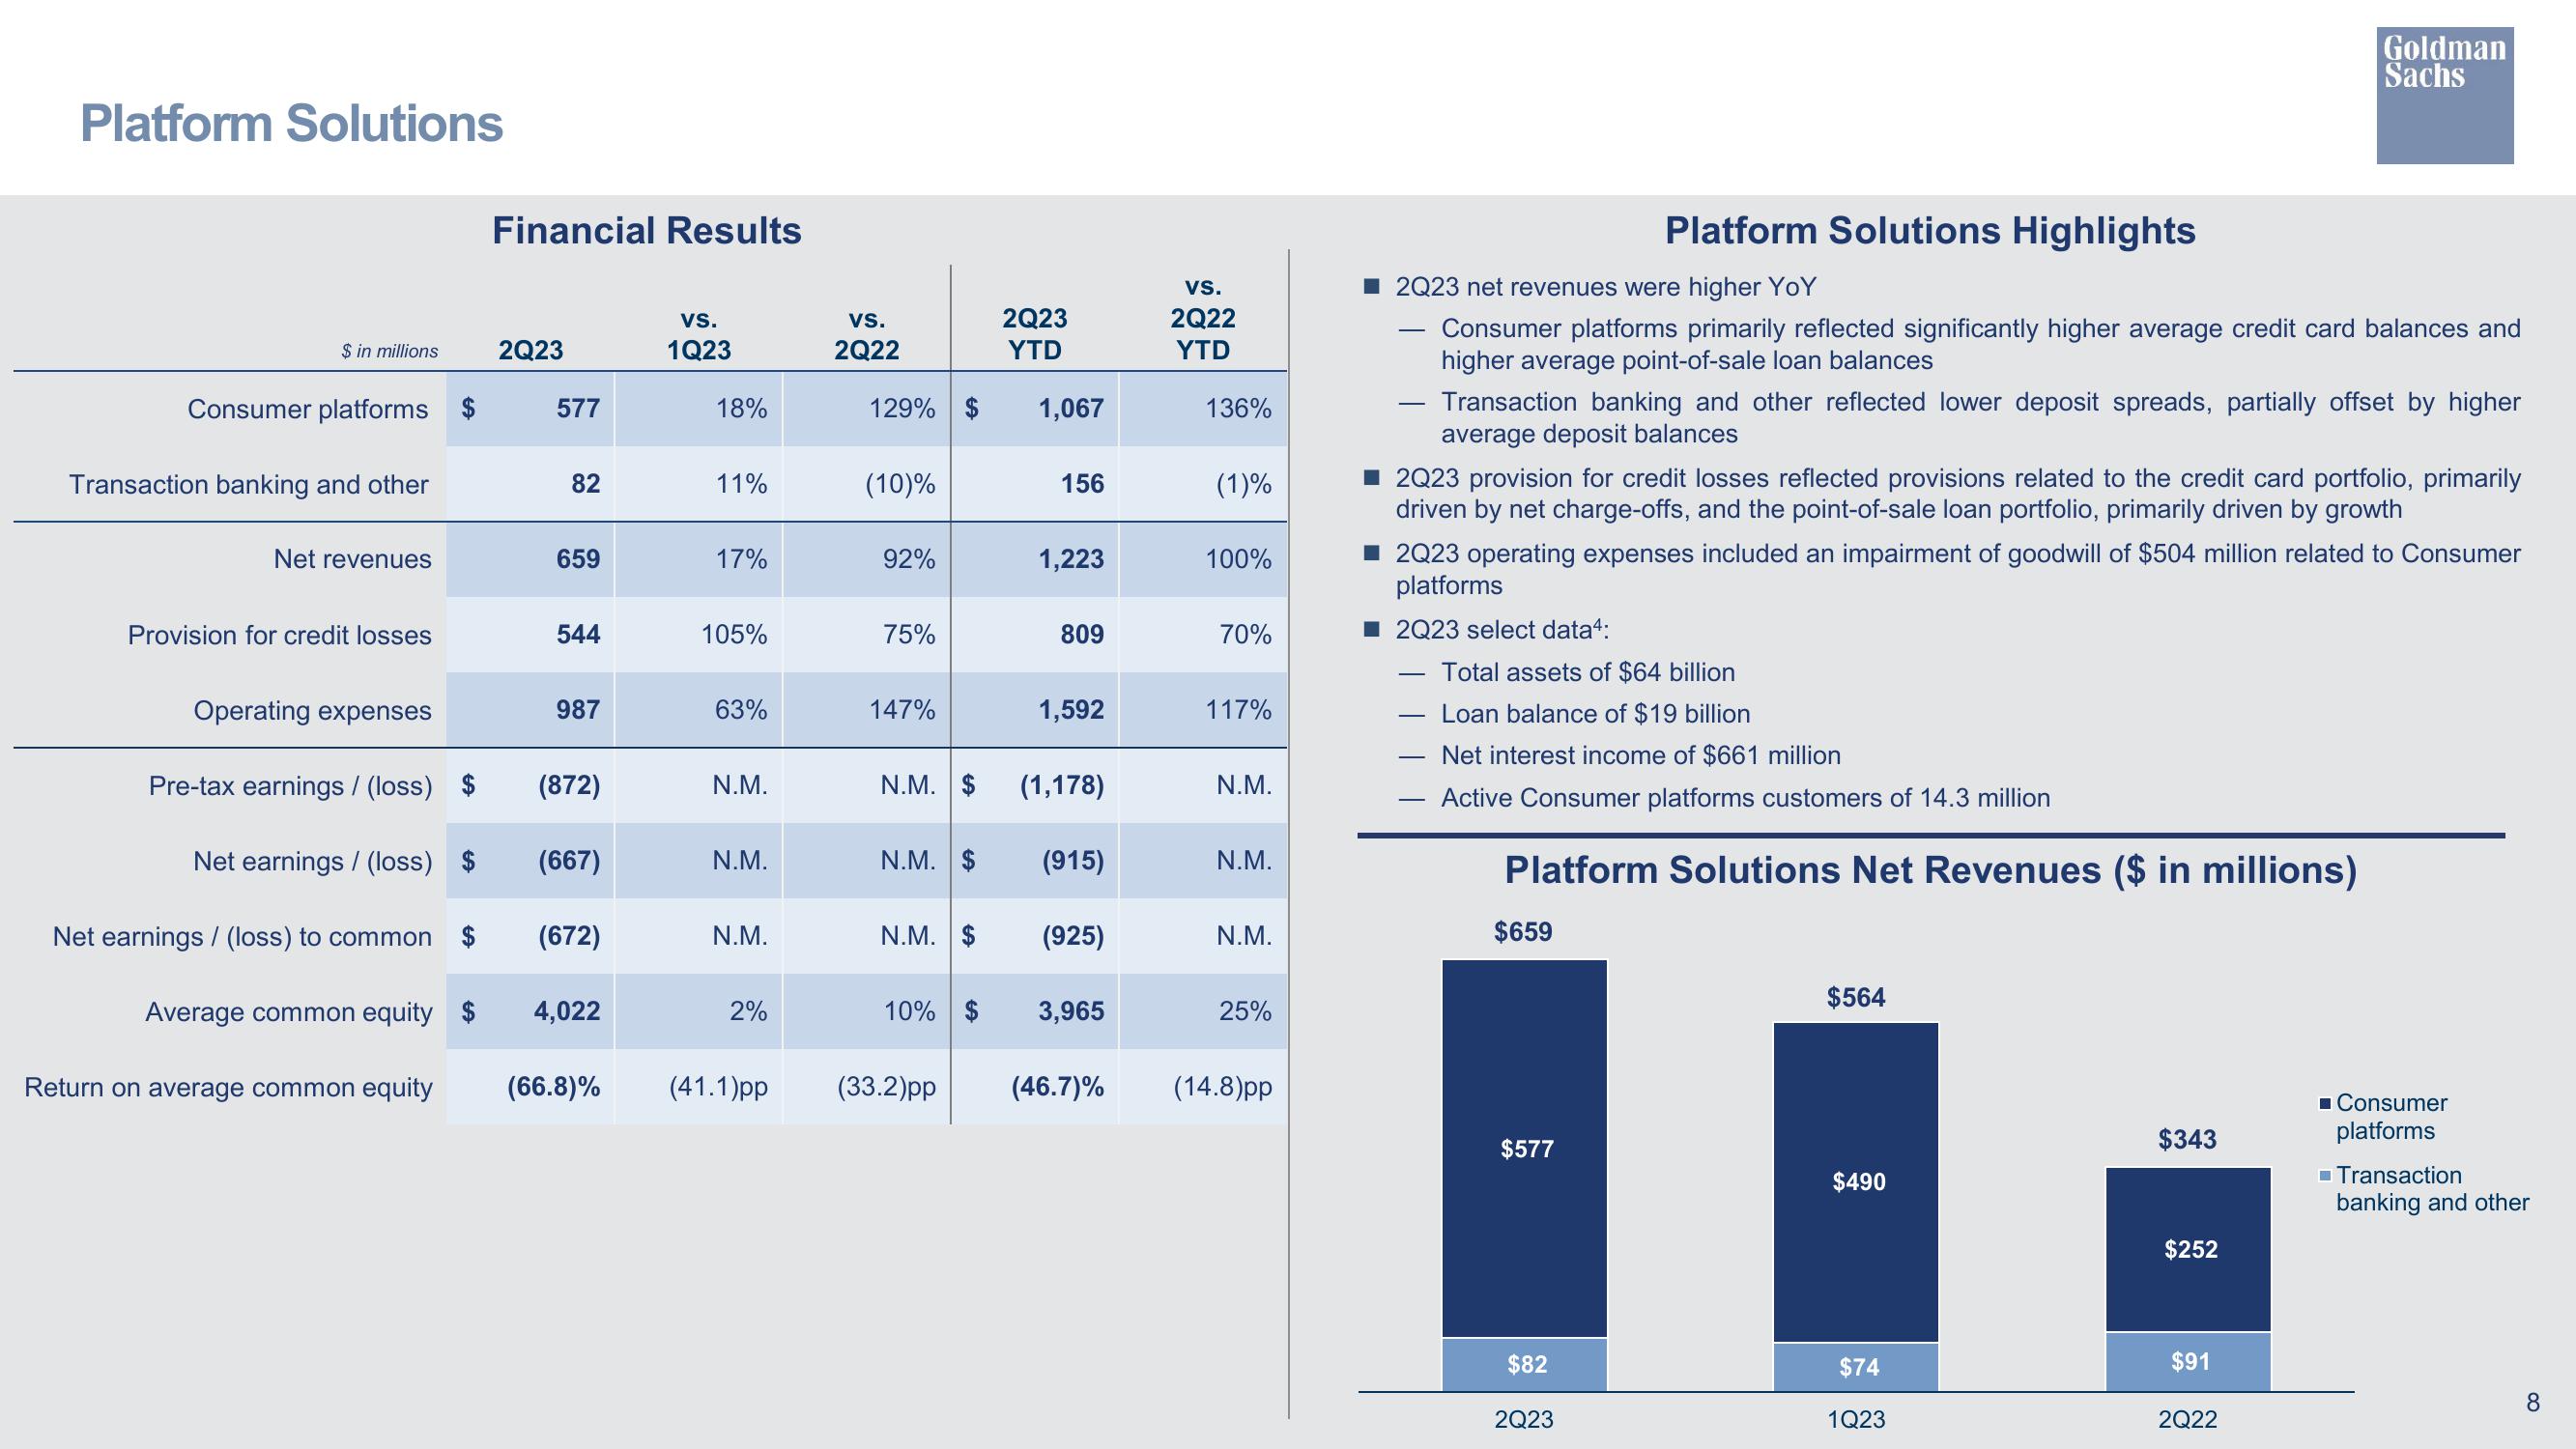
$ in millions
Consumer platforms
Transaction banking and other
Net revenues
Provision for credit losses
Operating expenses
Pre-tax earnings / (loss)
Net earnings / (loss) $
Net earnings / (loss) to common $
Average common equity $
Return on average common equity
Financial Results
2Q23
577
82
659
544
987
(872)
(667)
(672)
4,022
(66.8)%
VS.
1Q23
18%
11%
17%
105%
63%
N.M.
N.M.
N.M.
2%
VS.
2Q22
129% $
(10)%
92%
75%
147%
N.M. $
N.M. $
N.M. $
2Q23
YTD
(41.1)pp (33.2)pp
1,067
156
1,223
809
1,592
(1,178)
(915)
(925)
10% $ 3,965
(46.7)%
VS.
2Q22
YTD
136%
(1)%
100%
70%
117%
N.M.
N.M.
N.M.
25%
(14.8)pp
■2Q23 net revenues were higher YoY
Consumer platforms primarily reflected significantly higher average credit card balances and
higher average point-of-sale loan balances
Platform Solutions Highlights
Transaction banking and other reflected lower deposit spreads, partially offset by higher
average deposit balances
■2Q23 provision for credit losses reflected provisions related to the credit card portfolio, primarily
driven by net charge-offs, and the point-of-sale loan portfolio, primarily driven by growth
2Q23 operating expenses included an impairment of goodwill of $504 million related to Consumer
platforms
2Q23 select data4:
Total assets of $64 billion
Loan balance of $19 billion
Net interest income of $661 million
Active Consumer platforms customers of 14.3 million
Platform Solutions Net Revenues ($ in millions)
$659
$577
$82
2Q23
$564
$490
$74
1Q23
Goldman
Sachs
$343
$252
$91
2Q22
Consumer
platforms
☐Transaction
banking and other
8View entire presentation