Main Street Capital Investor Presentation Deck
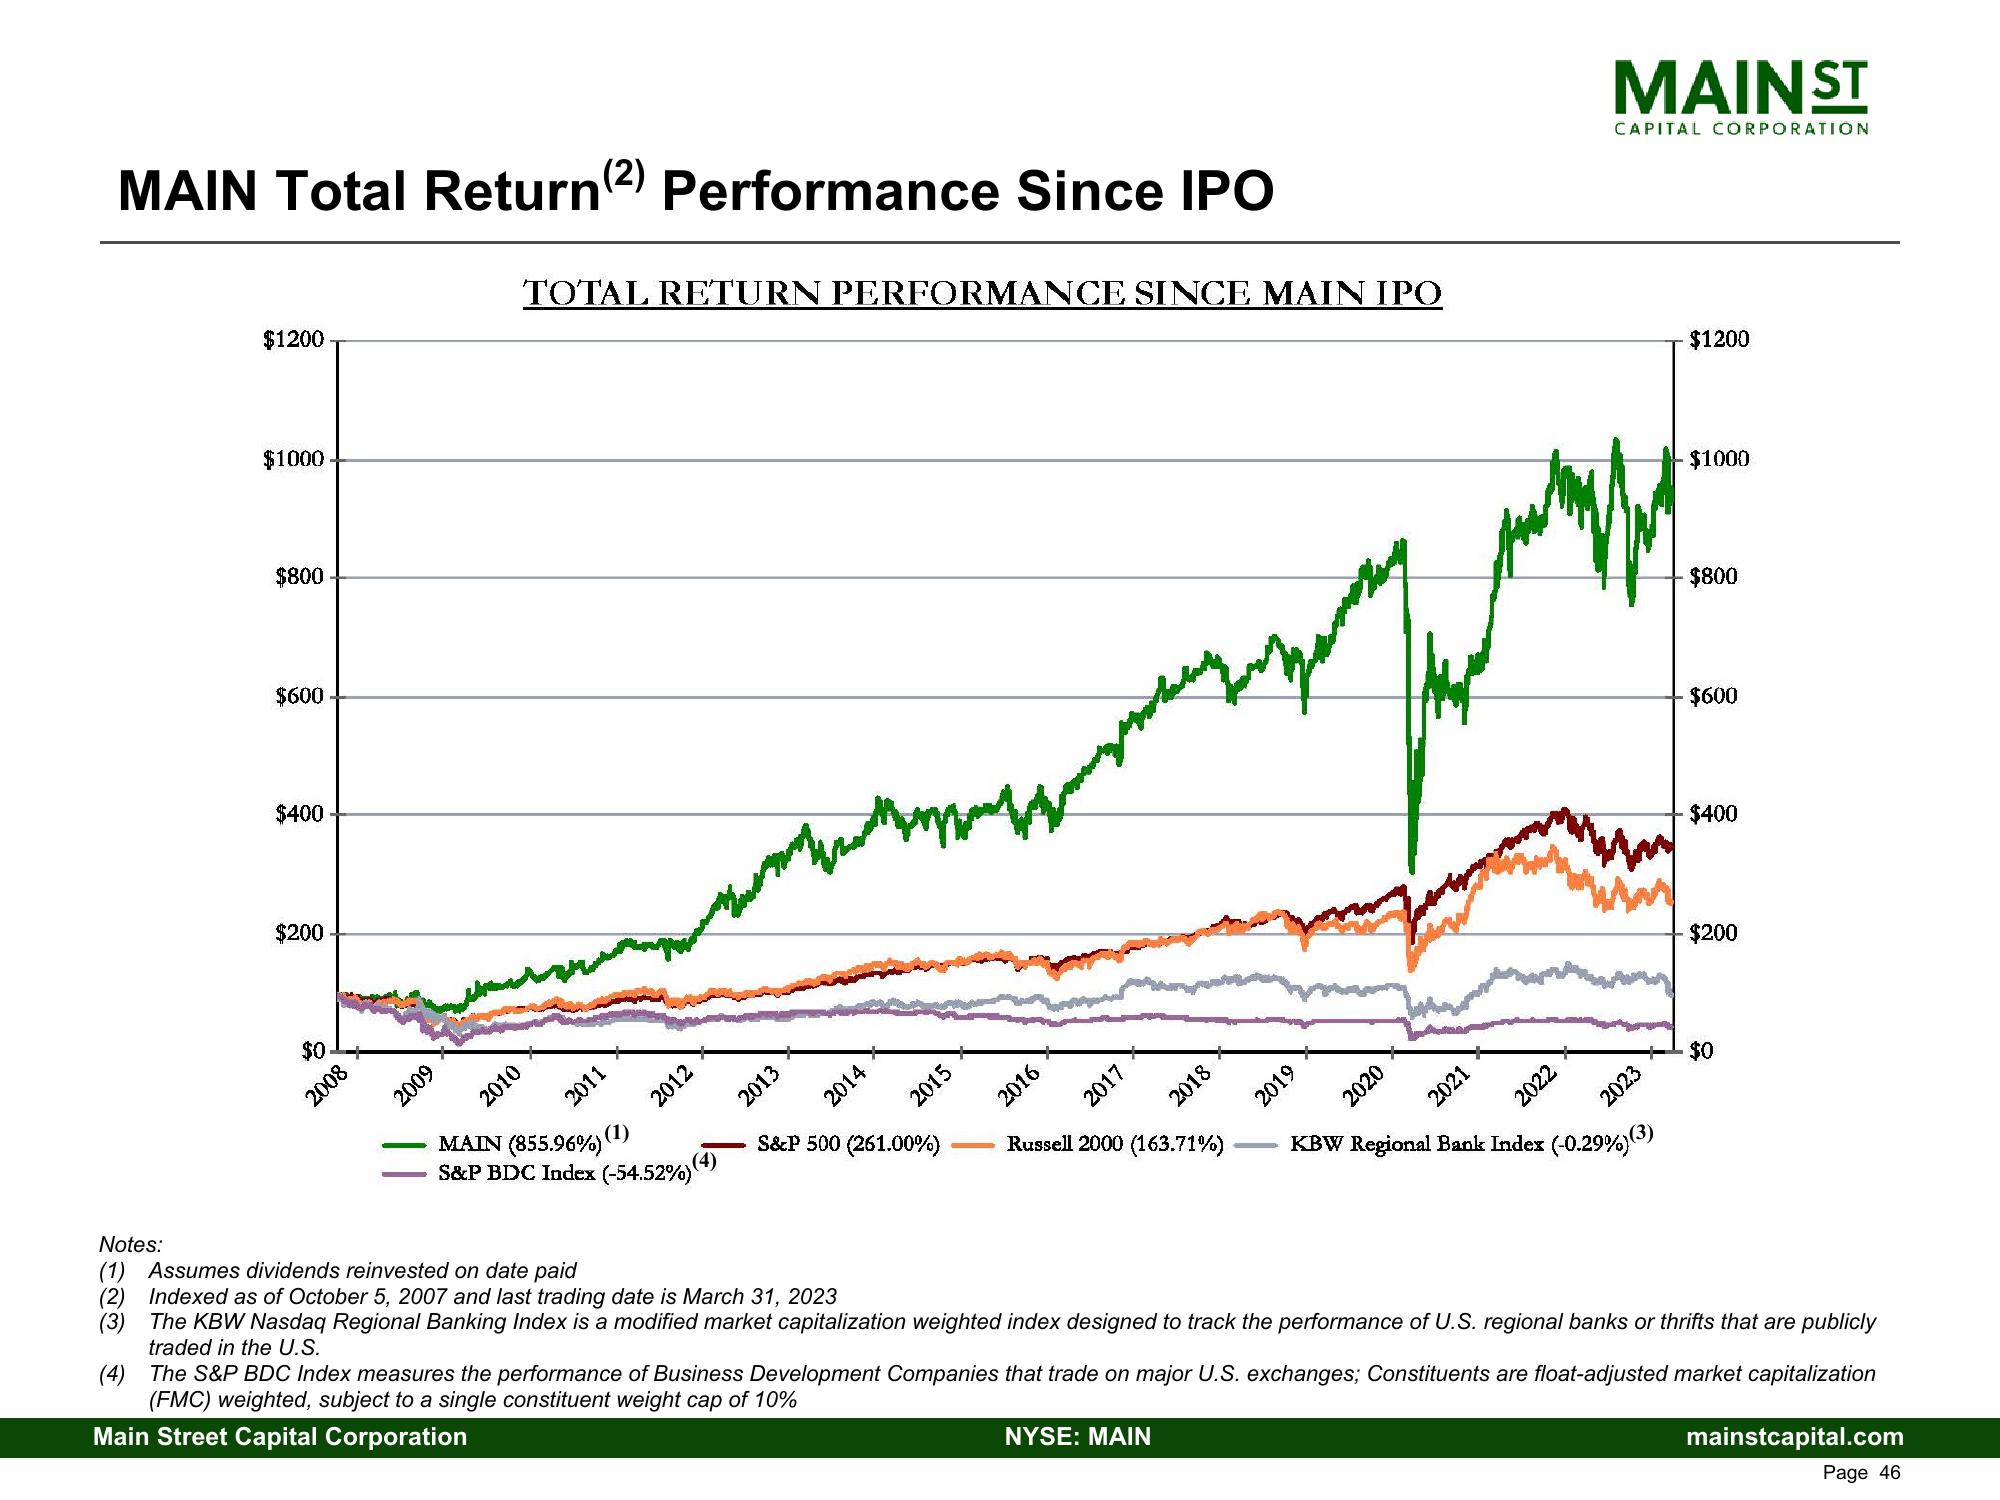
MAIN Total Return(2) Performance Since IPO
$1200
$1000
$800
$600
$400
$200
$0
2008
2009
TOTAL RETURN PERFORMANCE SINCE MAIN IPO
2010
2011
2012
MAIN (855.96%)
(1)
S&P BDC Index (-54.52%)
(4)
2013
2014
Notes:
(1) Assumes dividends reinvested on date paid
(2) Indexed as of October 5, 2007 and last trading date is March 31, 2023
(3)
2015
S&P 500 (261.00%)
2016
2017
2018
Russell 2000 (163.71%)
2019
NYSE: MAIN
2020
2021
2022
MAIN ST
CAPITAL CORPORATION
2023
KBW Regional Bank Index (-0.29%)(3)
$1200
$1000
$800
$600
$400
$200
$0
The KBW Nasdaq Regional Banking Index is a modified market capitalization weighted index designed to track the performance of U.S. regional banks or thrifts that are publicly
traded in the U.S.
(4) The S&P BDC Index measures the performance of Business Development Companies that trade on major U.S. exchanges; Constituents are float-adjusted market capitalization
(FMC) weighted, subject to a single constituent weight cap of 10%
Main Street Capital Corporation
mainstcapital.com
Page 46View entire presentation