TPG Results Presentation Deck
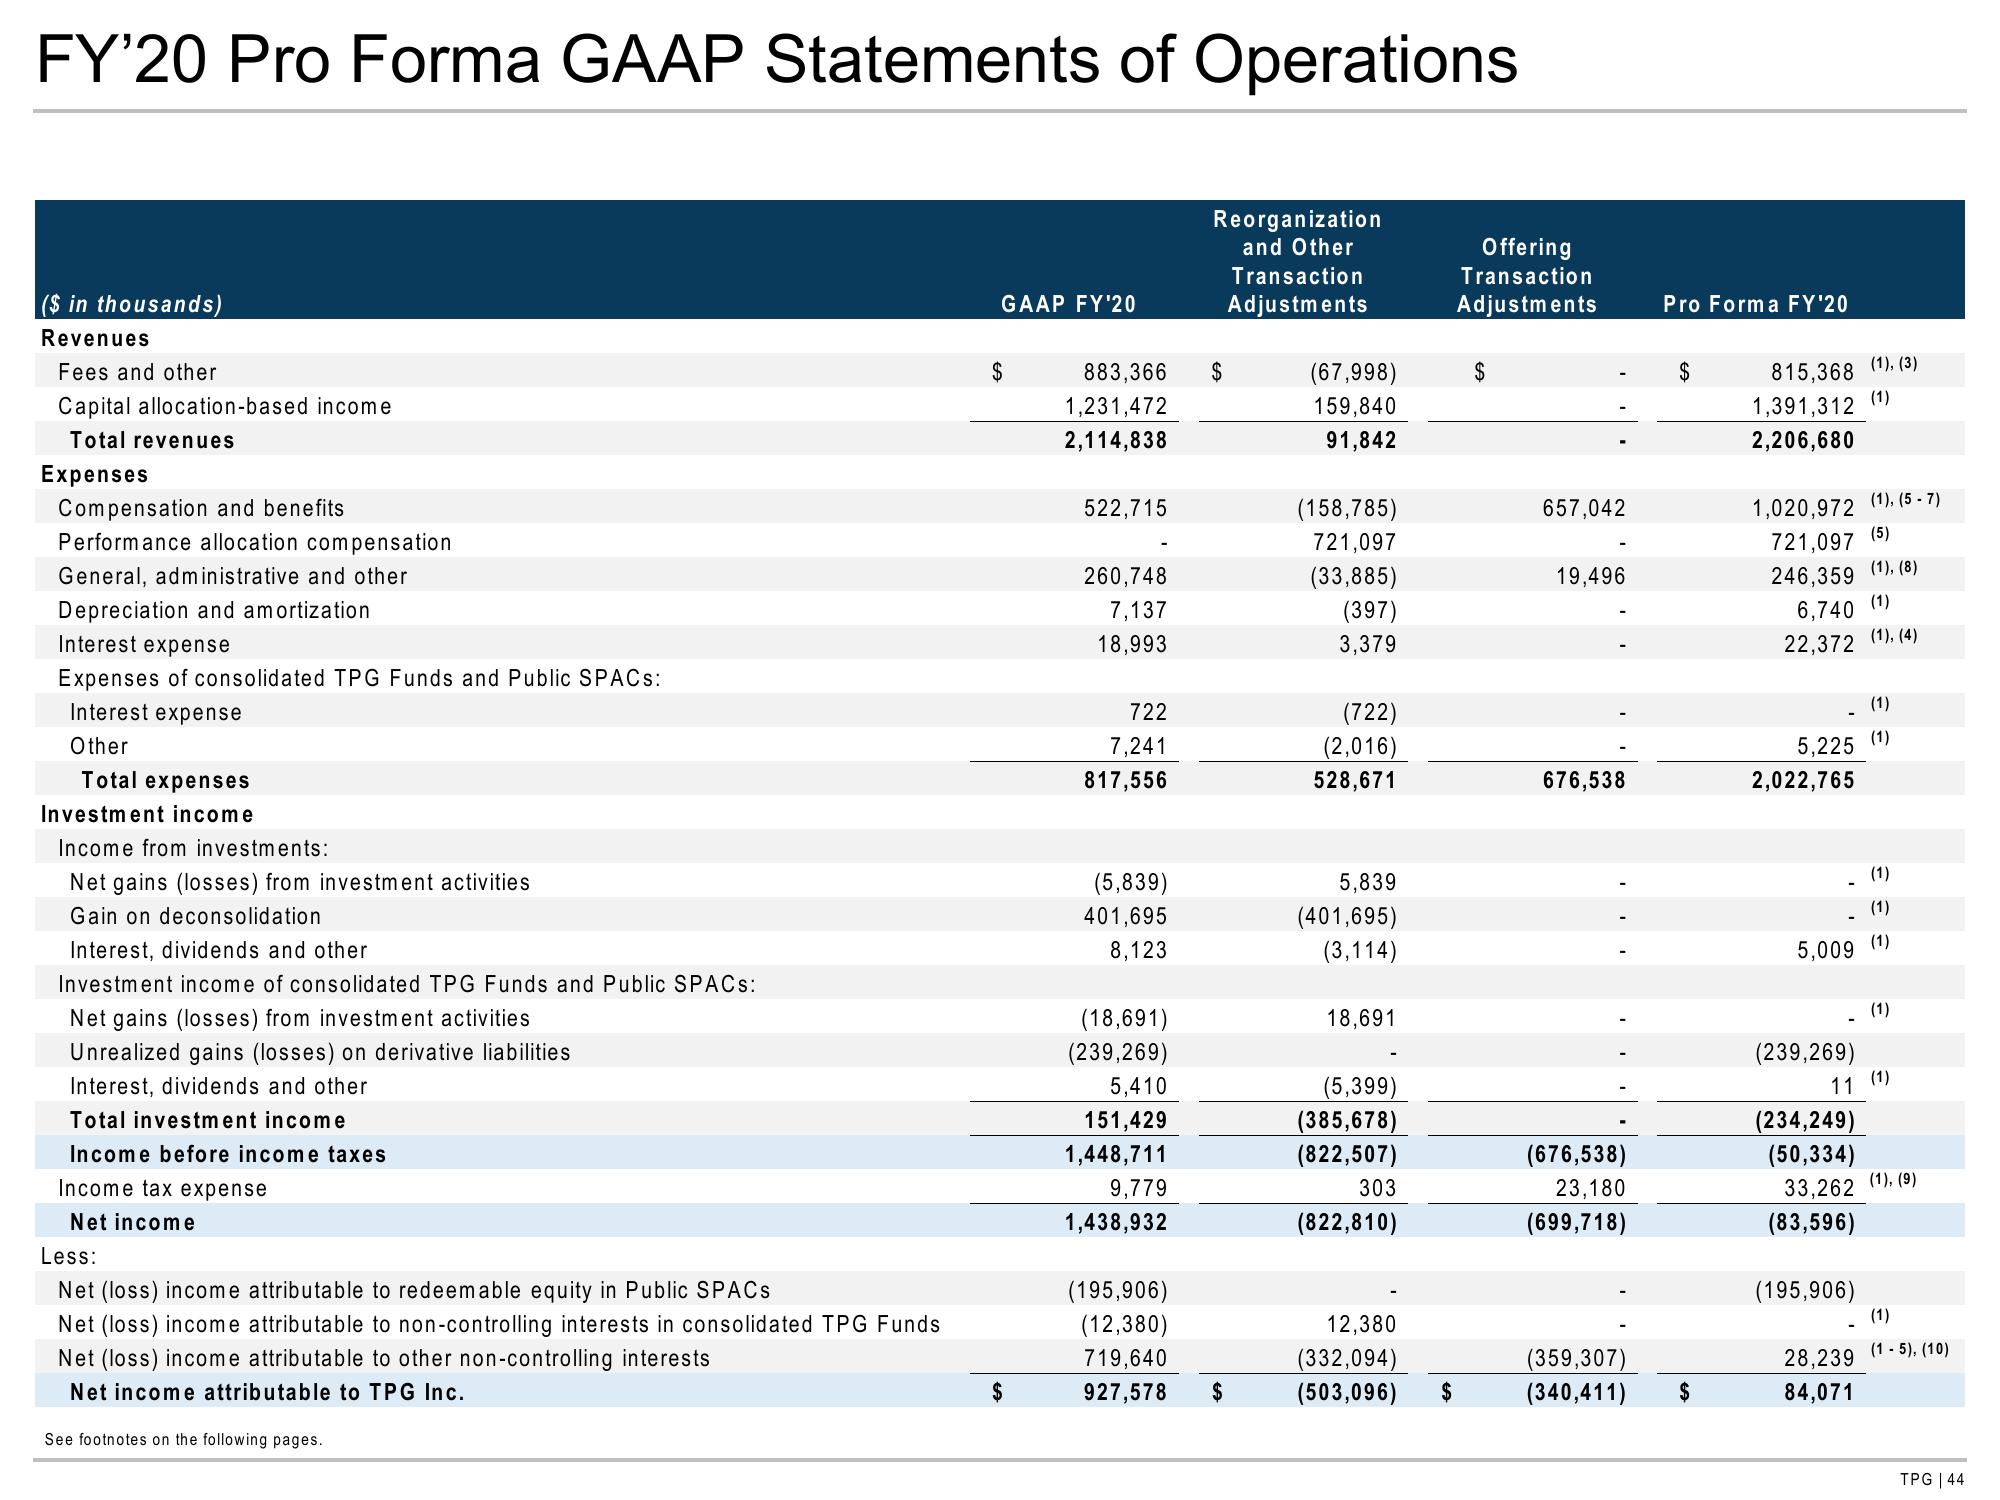
FY'20 Pro Forma GAAP Statements of Operations
($ in thousands)
Revenues
Fees and other
Capital allocation-based income
Total revenues
Expenses
Compensation and benefits
Performance allocation compensation
General, administrative and other
Depreciation and amortization
Interest expense
Expenses of consolidated TPG Funds and Public SPACs:
Interest expense
Other
Total expenses
Investment income
Income from investments:
Net gains (losses) from investment activities
Gain on deconsolidation
Interest, dividends and other
Investment income of consolidated TPG Funds and Public SPACs:
Net gains (losses) from investment activities
Unrealized gains (losses) on derivative liabilities
Interest, dividends and other
Total investment income
Income before income taxes
Income tax expense
Net income
Less:
Net (loss) income attributable to redeemable equity in Public SPACS
Net (loss) income attributable to non-controlling interests in consolidated TPG Funds
Net (loss) income attributable to other non-controlling interests
Net income attributable to TPG Inc.
See footnotes on the following pages.
GAAP FY'20
$
$
883,366
1,231,472
2,114,838
522,715
260,748
7,137
18,993
722
7,241
817,556
(5,839)
401,695
8,123
(18,691)
(239,269)
5,410
151,429
1,448,711
9,779
1,438,932
(195,906)
(12,380)
719,640
927,578
Reorganization
and Other
Transaction
Adjustments
$
$
(67,998)
159,840
91,842
(158,785)
721,097
(33,885)
(397)
3,379
(722)
(2,016)
528,671
5,839
(401,695)
(3,114)
18,691
(5,399)
(385,678)
(822,507)
303
(822,810)
12,380
(332,094)
(503,096)
$
Offering
Transaction
Adjustments
$
657,042
19,496
676,538
(676,538)
23,180
(699,718)
(359,307)
(340,411)
Pro Forma FY'20
$
$
815,368 (1), (3)
(1)
1,391,312
2,206,680
1,020,972 (1), (5-7)
(5)
(1), (8)
(1)
721,097
246,359
6,740
22,372 (1), (4)
5,225
2,022,765
(239,269)
11
(234,249)
(50,334)
33,262
(83,596)
(195,906)
(1)
(1)
5,009 (1)
28,239
84,071
(1)
€ E
(1)
(1)
(1), (9)
(1)
(1-5), (10)
TPG | 44View entire presentation