Uber Results Presentation Deck
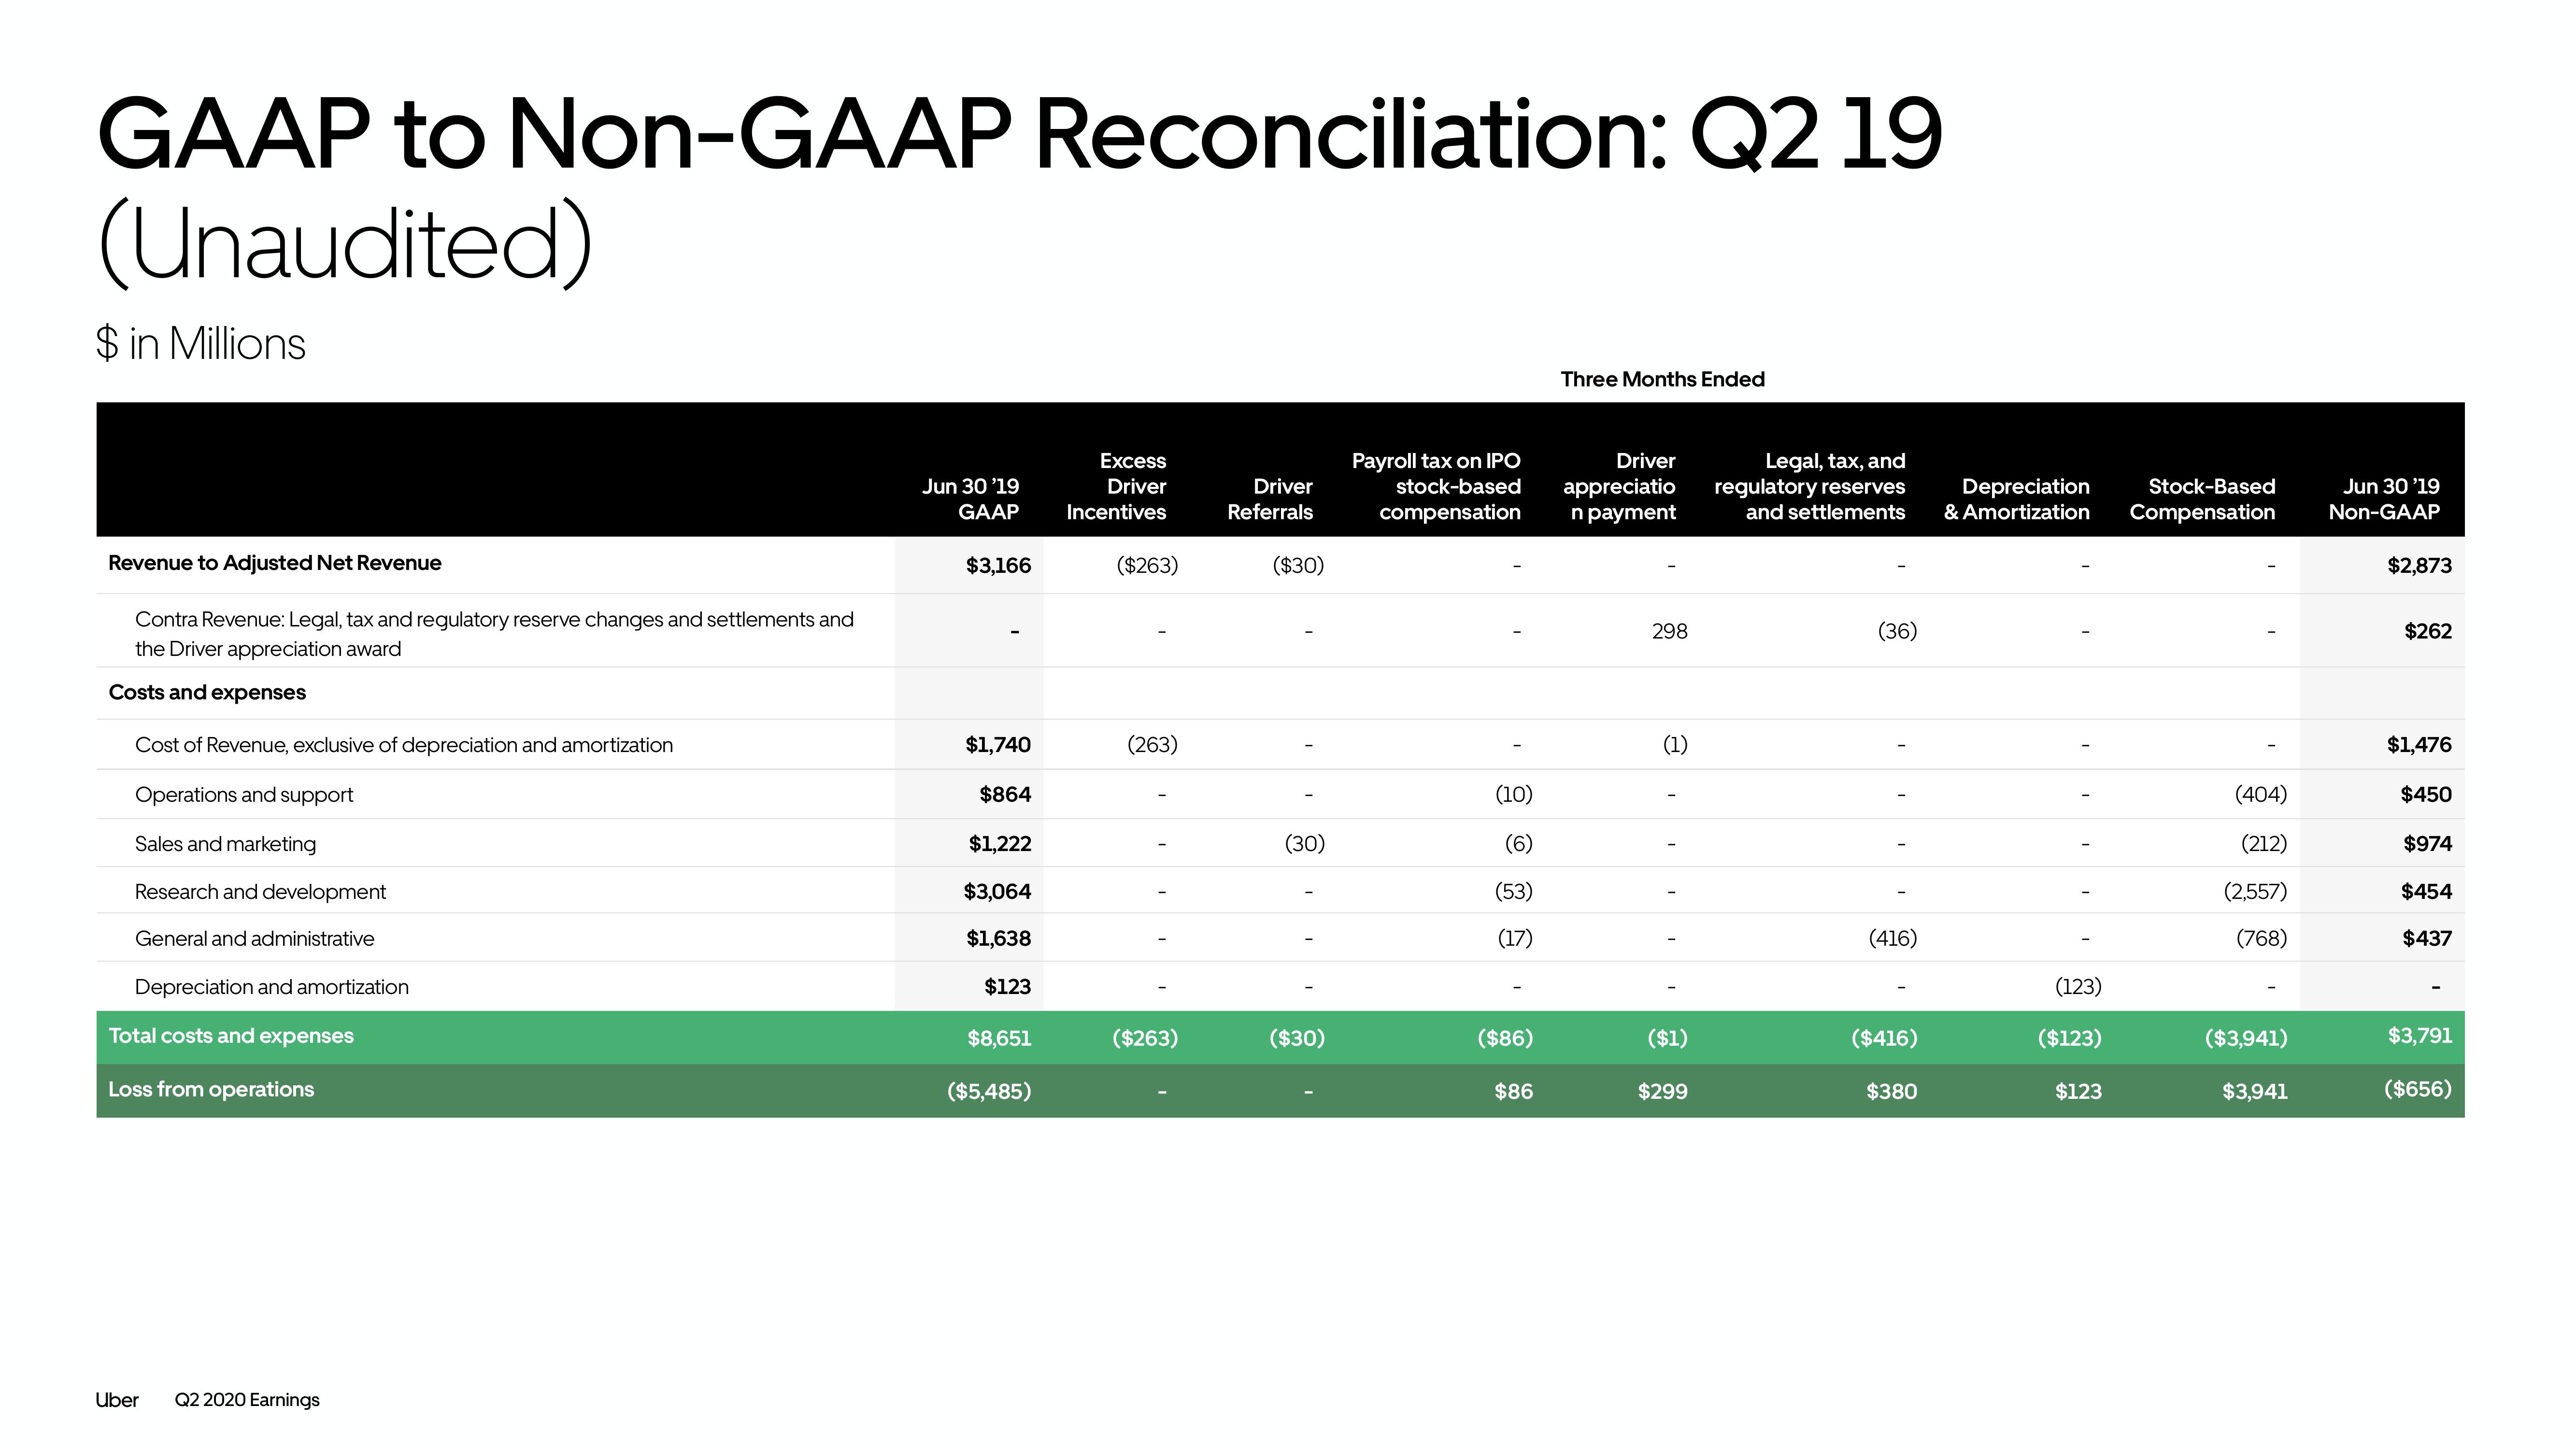
GAAP to Non-GAAP Reconciliation: Q2 19
(Unaudited)
$ in Millions
Revenue to Adjusted Net Revenue
Contra Revenue: Legal, tax and regulatory reserve changes and settlements and
the Driver appreciation award
Costs and expenses
Cost of Revenue, exclusive of depreciation and amortization
Operations and support
Sales and marketing
Research and development
General and administrative
Depreciation and amortization
Total costs and expenses
Loss from operations
Uber Q2 2020 Earnings
Jun 30 '19
GAAP
$3,166
$1,740
$864
$1,222
$3,064
$1,638
$123
$8,651
($5,485)
Excess
Driver
Incentives
($263)
(263)
($263)
Driver
Referrals
($30)
(30)
($30)
Payroll tax on IPO
stock-based
compensation
(10)
(6)
(53)
(17)
($86)
$86
Three Months Ended
Driver
appreciatio
n payment
298
(1)
-----
($1)
$299
Legal, tax, and
regulatory reserves
and settlements
(36)
(416)
($416)
$380
Depreciation
Stock-Based
& Amortization Compensation
(123)
($123)
$123
(404)
(212)
(2,557)
(768)
($3,941)
$3,941
Jun 30 '19
Non-GAAP
$2,873
$262
$1,476
$450
$974
$454
$437
$3,791
($656)View entire presentation