AngloAmerican Results Presentation Deck
Unit costs performance by Business
154
2022
59
Copper (C1 USc/lb)¹
179
Anglo American
H1 2023
~166
63
2023F
De Beers (US$/ct)³
~75
Chile:
~205c/lb
Peru:
-100c/lb
513
2022
Nickel (C1 USc/lb)
38
550
H1 2023
~560
Iron Ore (FOB US$/t)4
36
2023F
-39
Kumba:
-$43/t
Minas-Rio:
-$33/t
2023F
PGMs (US$/PGM oz)²
937
2022
107
993
H12023
2022
Steelmaking Coal (US$/t)5
135
~1,000
2022
H1 2023
2023F
2022
H12023
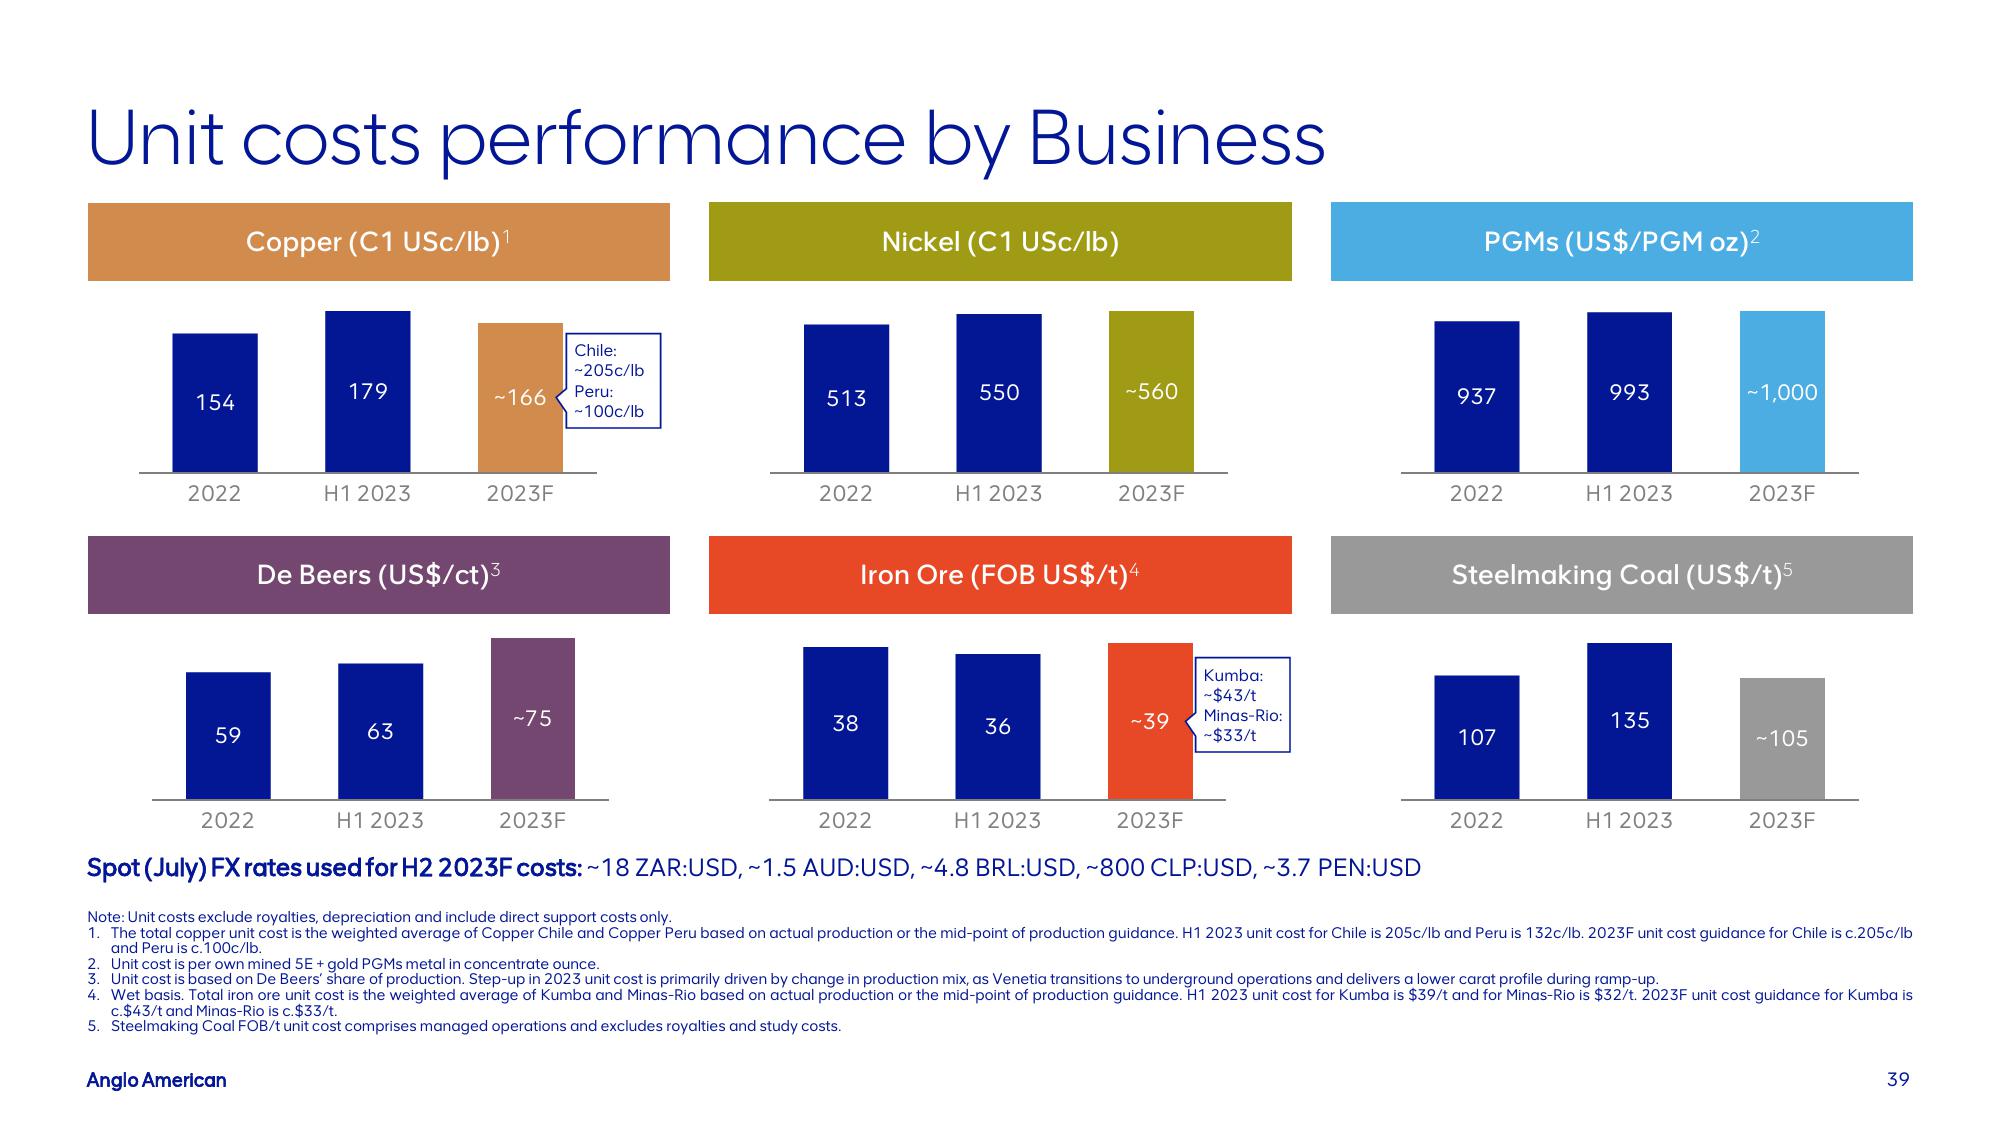
Spot (July) FX rates used for H2 2023F costs: ~18 ZAR:USD, ~1.5 AUD:USD, ~4.8 BRL:USD, ~800 CLP:USD, ~3.7 PEN:USD
Note: Unit costs exclude royalties, depreciation and include direct support costs only.
1. The total copper unit cost is the weighted average of Copper Chile and Copper Peru based on actual production or the mid-point of production guidance. H1 2023 unit cost for Chile is 205c/lb and Peru is 132c/lb. 2023F unit cost guidance for Chile is c.205c/lb
and Peru is c. 100c/lb.
2. Unit cost is per own mined 5E + gold PGMs metal in concentrate ounce.
3. Unit cost is based on De Beers' share of production. Step-up in 2023 unit cost is primarily driven by change in production mix, as Venetia transitions to underground operations and delivers a lower carat profile during ramp-up.
2023F
H12023
- 105
2023F
4. Wet basis. Total iron ore unit cost is the weighted average of Kumba and Minas-Rio based on actual production or the mid-point of production guidance. H1 2023 unit cost for Kumba is $39/t and for Minas-Rio is $32/t. 2023F unit cost guidance for Kumba is
c.$43/t and Minas-Rio is c. $33/t.
5. Steelmaking Coal FOB/t unit cost comprises managed operations and excludes royalties and study costs.
39View entire presentation