Barclays Investment Banking Pitch Book
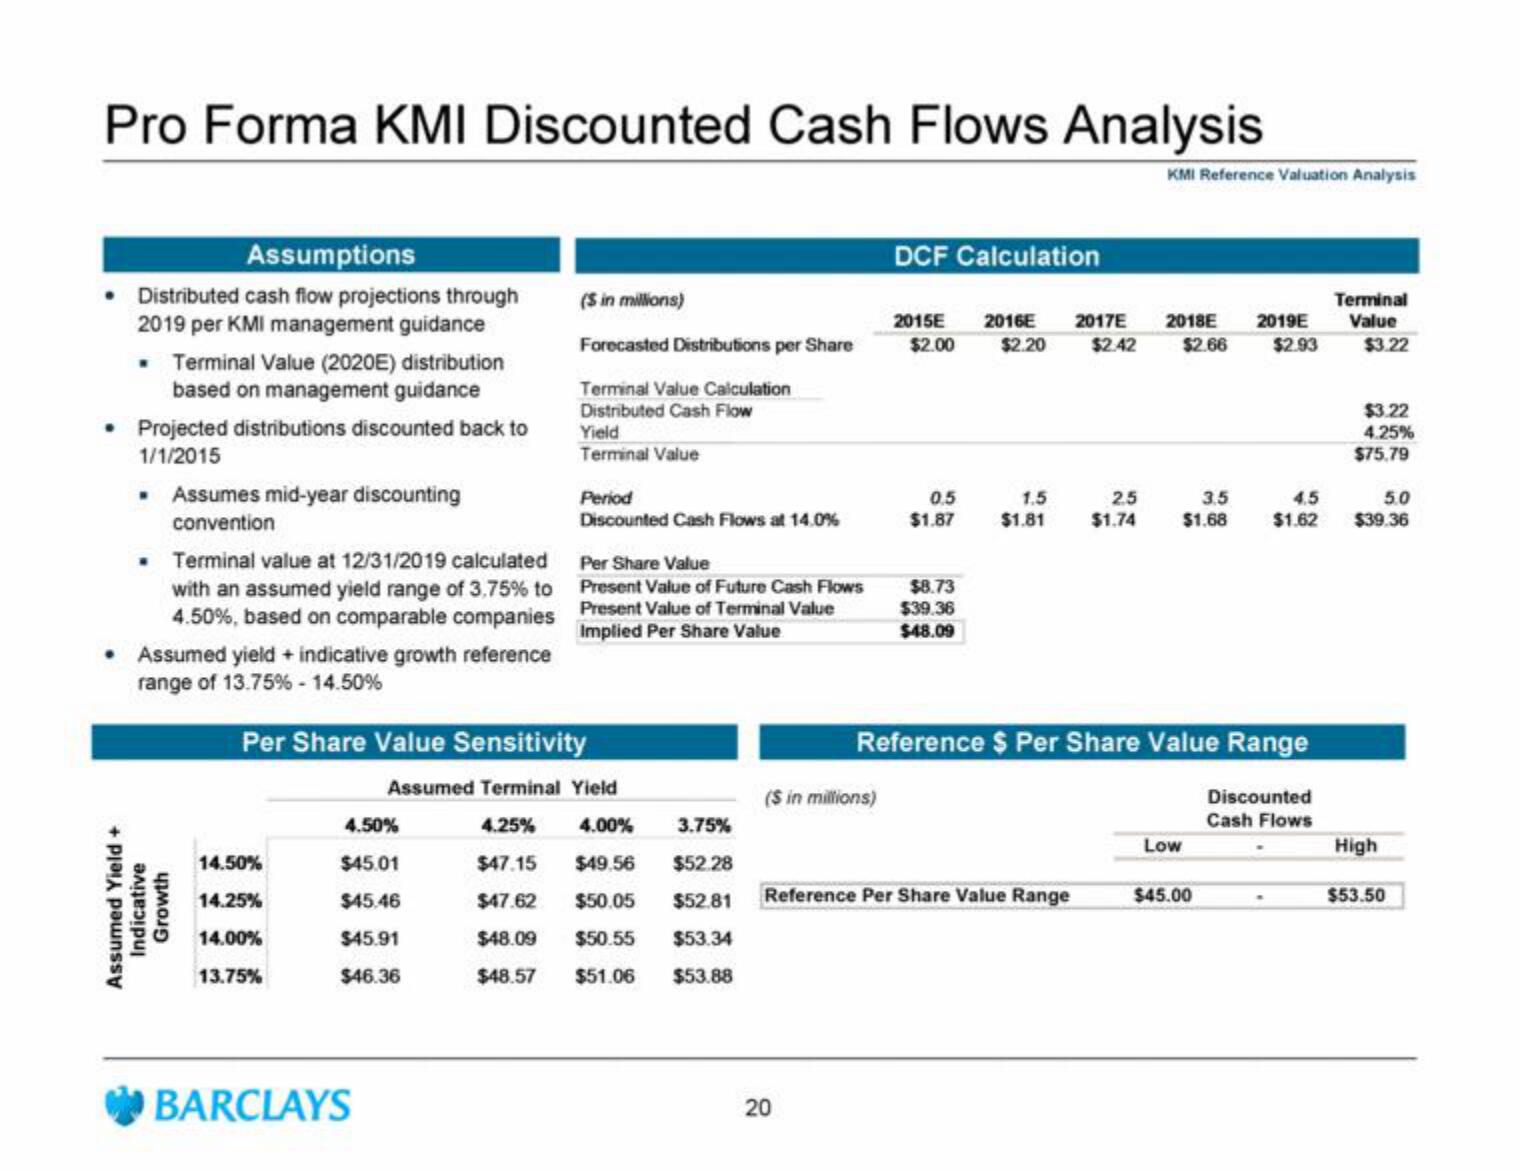
Pro Forma KMI Discounted Cash Flows Analysis
Assumptions
Distributed cash flow projections through
2019 per KMI management guidance
• Terminal Value (2020E) distribution
based on management guidance
• Projected distributions discounted back to
1/1/2015
. Assumes mid-year discounting
convention
. Terminal value at 12/31/2019 calculated
with an assumed yield range of 3,75% to
4.50%, based on comparable companies
• Assumed yield + indicative growth reference
range of 13.75% -14.50%
Assumed Yield +
Indicative
Growth
14.50%
14.25%
14.00%
13.75%
4.50%
$45.01
$45.46
$45.91
$46.36
(S in millions)
Forecasted Distributions per Share
Terminal Value Calculation
Distributed Cash Flow
BARCLAYS
Yield
Terminal Value
Per Share Value Sensitivity
Assumed Terminal Yield
4.25% 4.00%
3.75%
$47.15 $49.56
$52.28
$47.62 $50.05 $52.81
$48.09 $50.55 $53.34
$48.57 $51.06 $53.88
Period
Discounted Cash Flows at 14.0%
Per Share Value
Present Value of Future Cash Flows
Present Value of Terminal Value
Implied Per Share Value
($ in millions)
DCF Calculation
20
2015E 2016E 2017E
$2.00 $2.20 $2.42
0.5
$1.87
$8.73
$39.36
$48.09
1.5
$1.81
Reference Per Share Value Range
2.5
$1.74
KMI Reference Valuation Analysis
2018E 2019E
$2.66
$2.93
Reference $ Per Share Value Range
3.5
$1.68
Low
4.5
$1.62
$45.00
Discounted
Cash Flows
Terminal
Value
$3.22
$3.22
4.25%
$75.79
5.0
$39.36
High
$53.50View entire presentation