LegalZoom.com Investor Presentation Deck slide image

LegalZoom.com Investor Presentation Deck

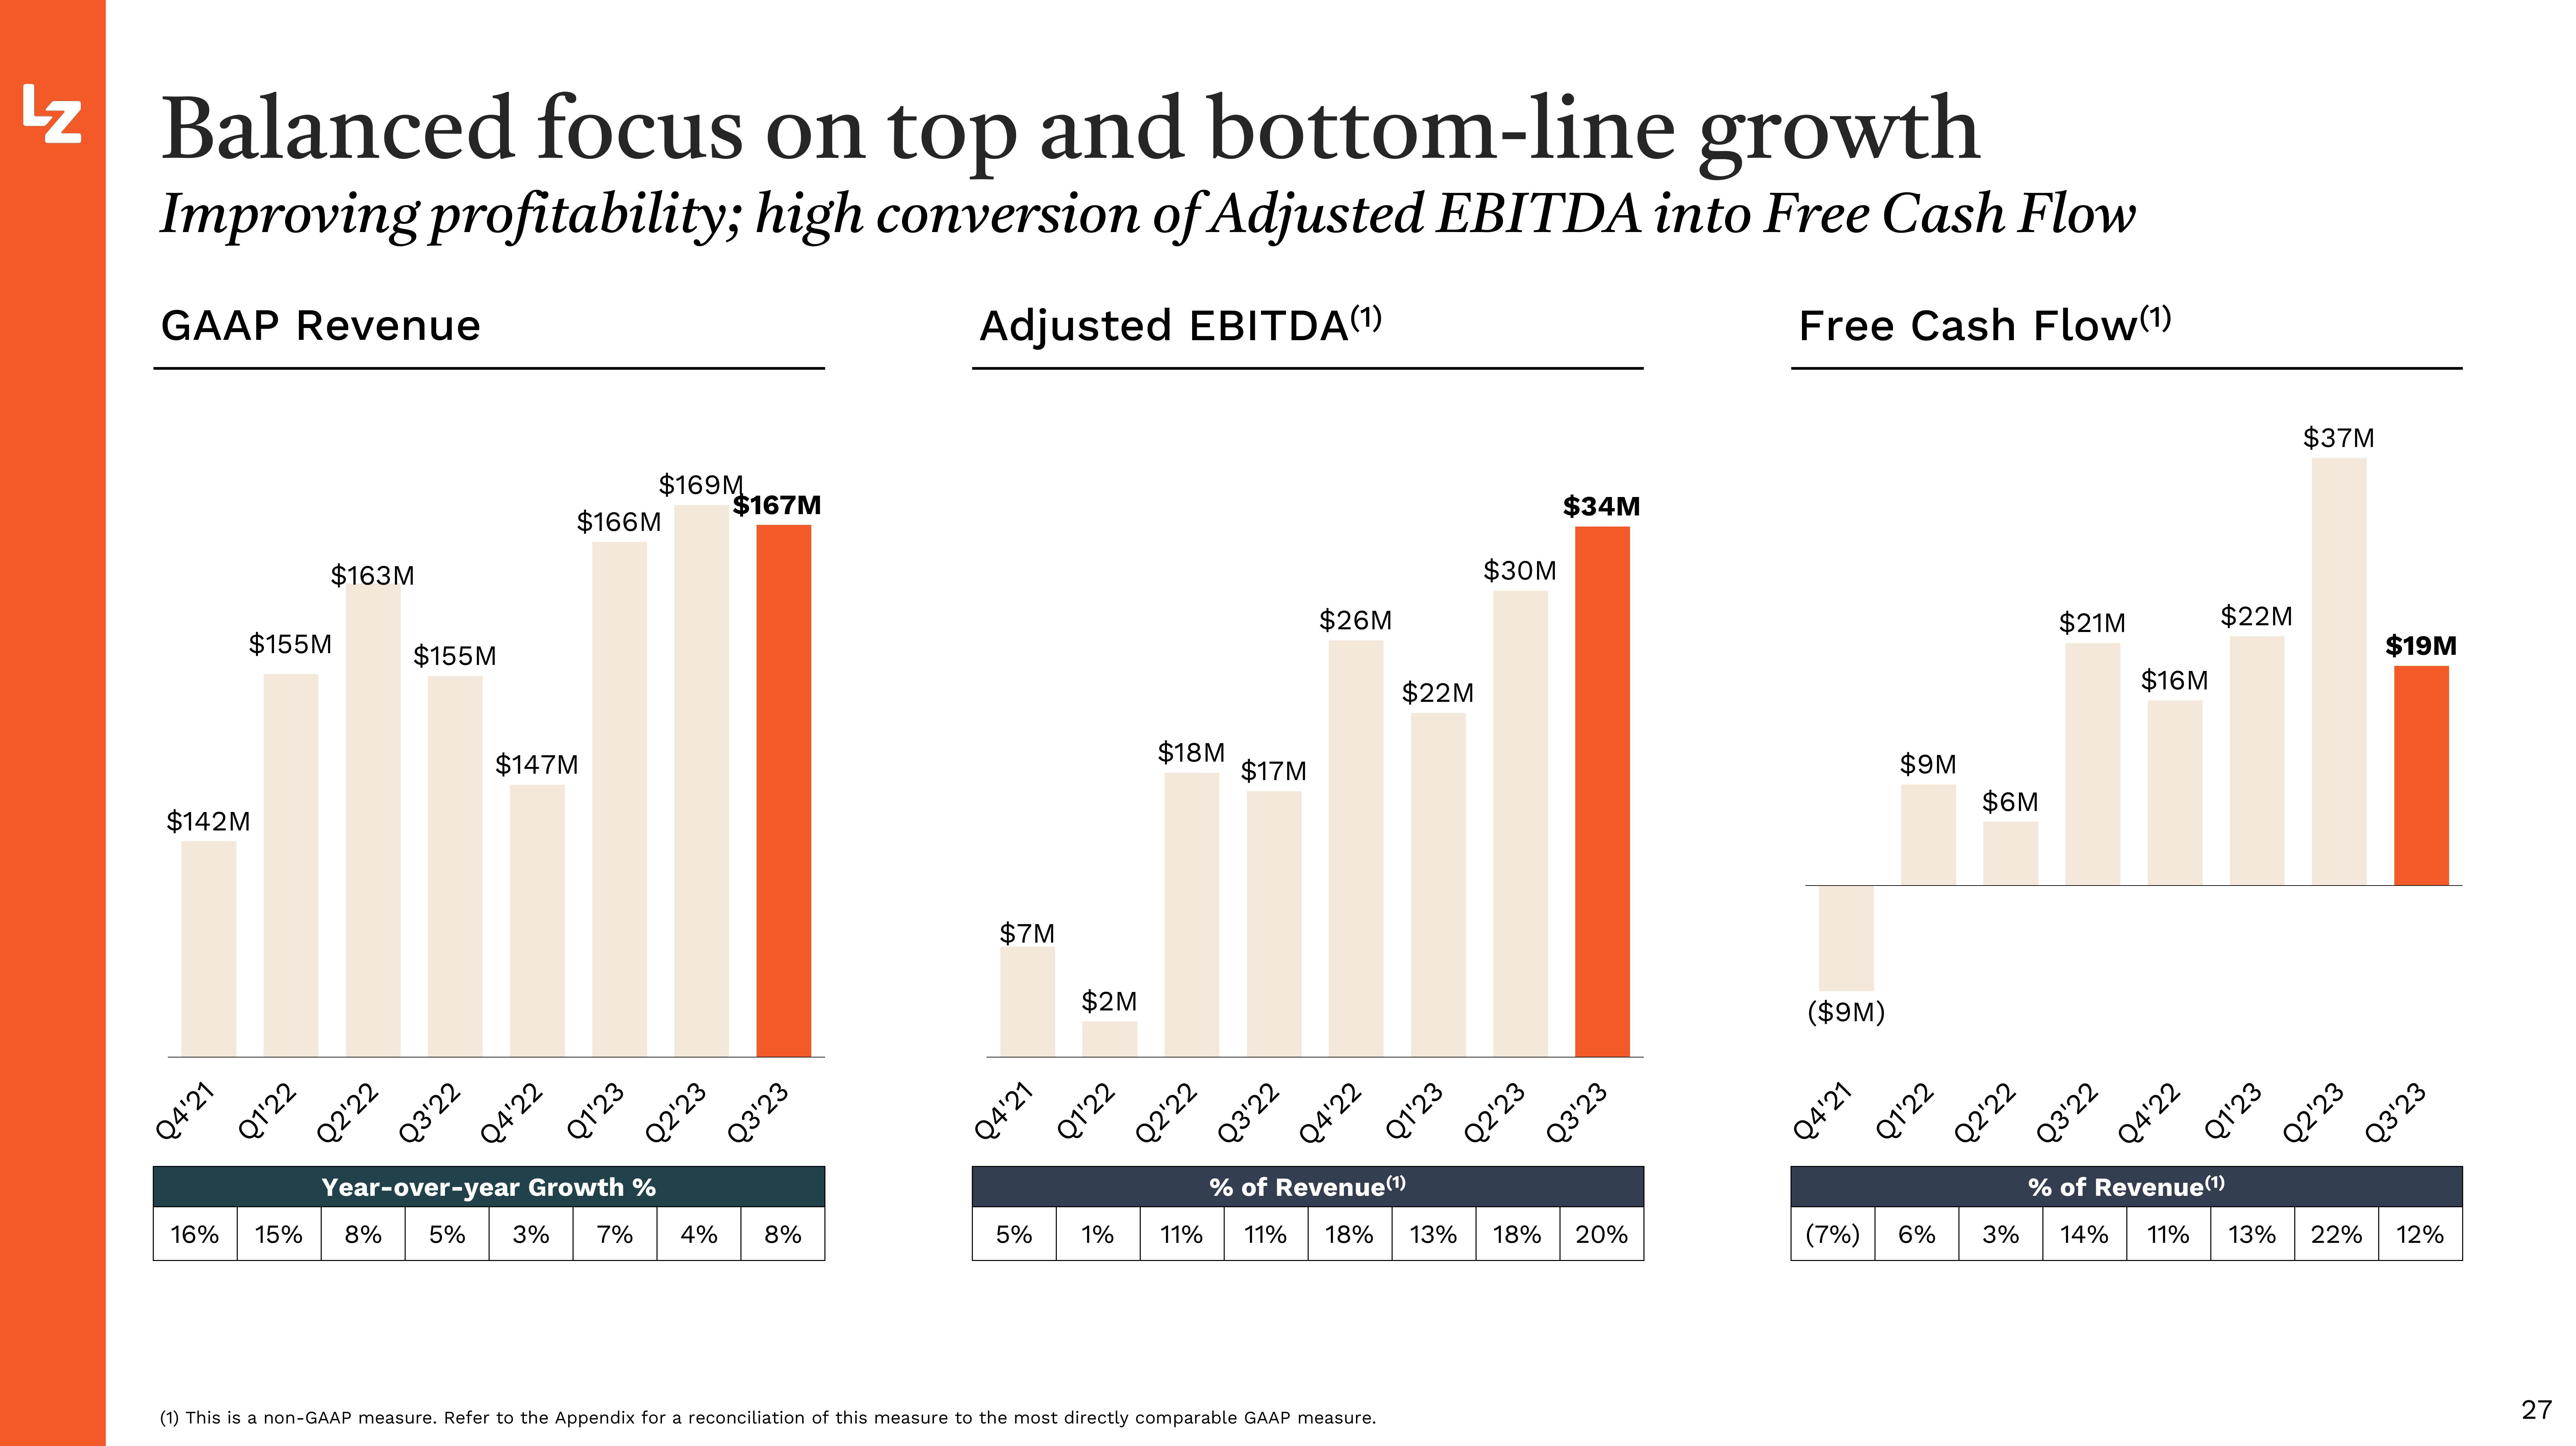
Lz Balanced focus on top and bottom-line growth Improving profitability; high conversion of Adjusted EBITDA into Free Cash Flow Adjusted EBITDA (¹) Free Cash Flow (1) GAAP Revenue $155M $142M Q4'21 Q1'22 $163M Q2'22 $155M Q3'22 $147M Q4'22 $166M $169M Q1'23 Q2'23 $167M Q3'23 Year-over-year Growth % 16% 15% 8% 5% 3% 7% 4% 8% $7M Q4'21 5% $2M Q1'22 1% $18M Q2'22 $17M Q3'22 $26M Q4'22 $22M (1) This is a non-GAAP measure. Refer to the Appendix for a reconciliation of this measure to the most directly comparable GAAP measure. Q1'23 $30M Q2'23 % of Revenue (1) 11% 11% 18% 13% 18% $34M Q3'23 20% ($9M) Q4'21 $9M Q1'22 (7%) 6% $6M Q2'22 $21M Q3'22 $16M Q4'22 $22M Q1'23 $37M Q2'23 $19M Q3'23 % of Revenue (1) 3% 14% 11% 13% 22% 12% 27
View entire presentation