Pershing Square Activist Presentation Deck
II. Pershing's View of McDonald's
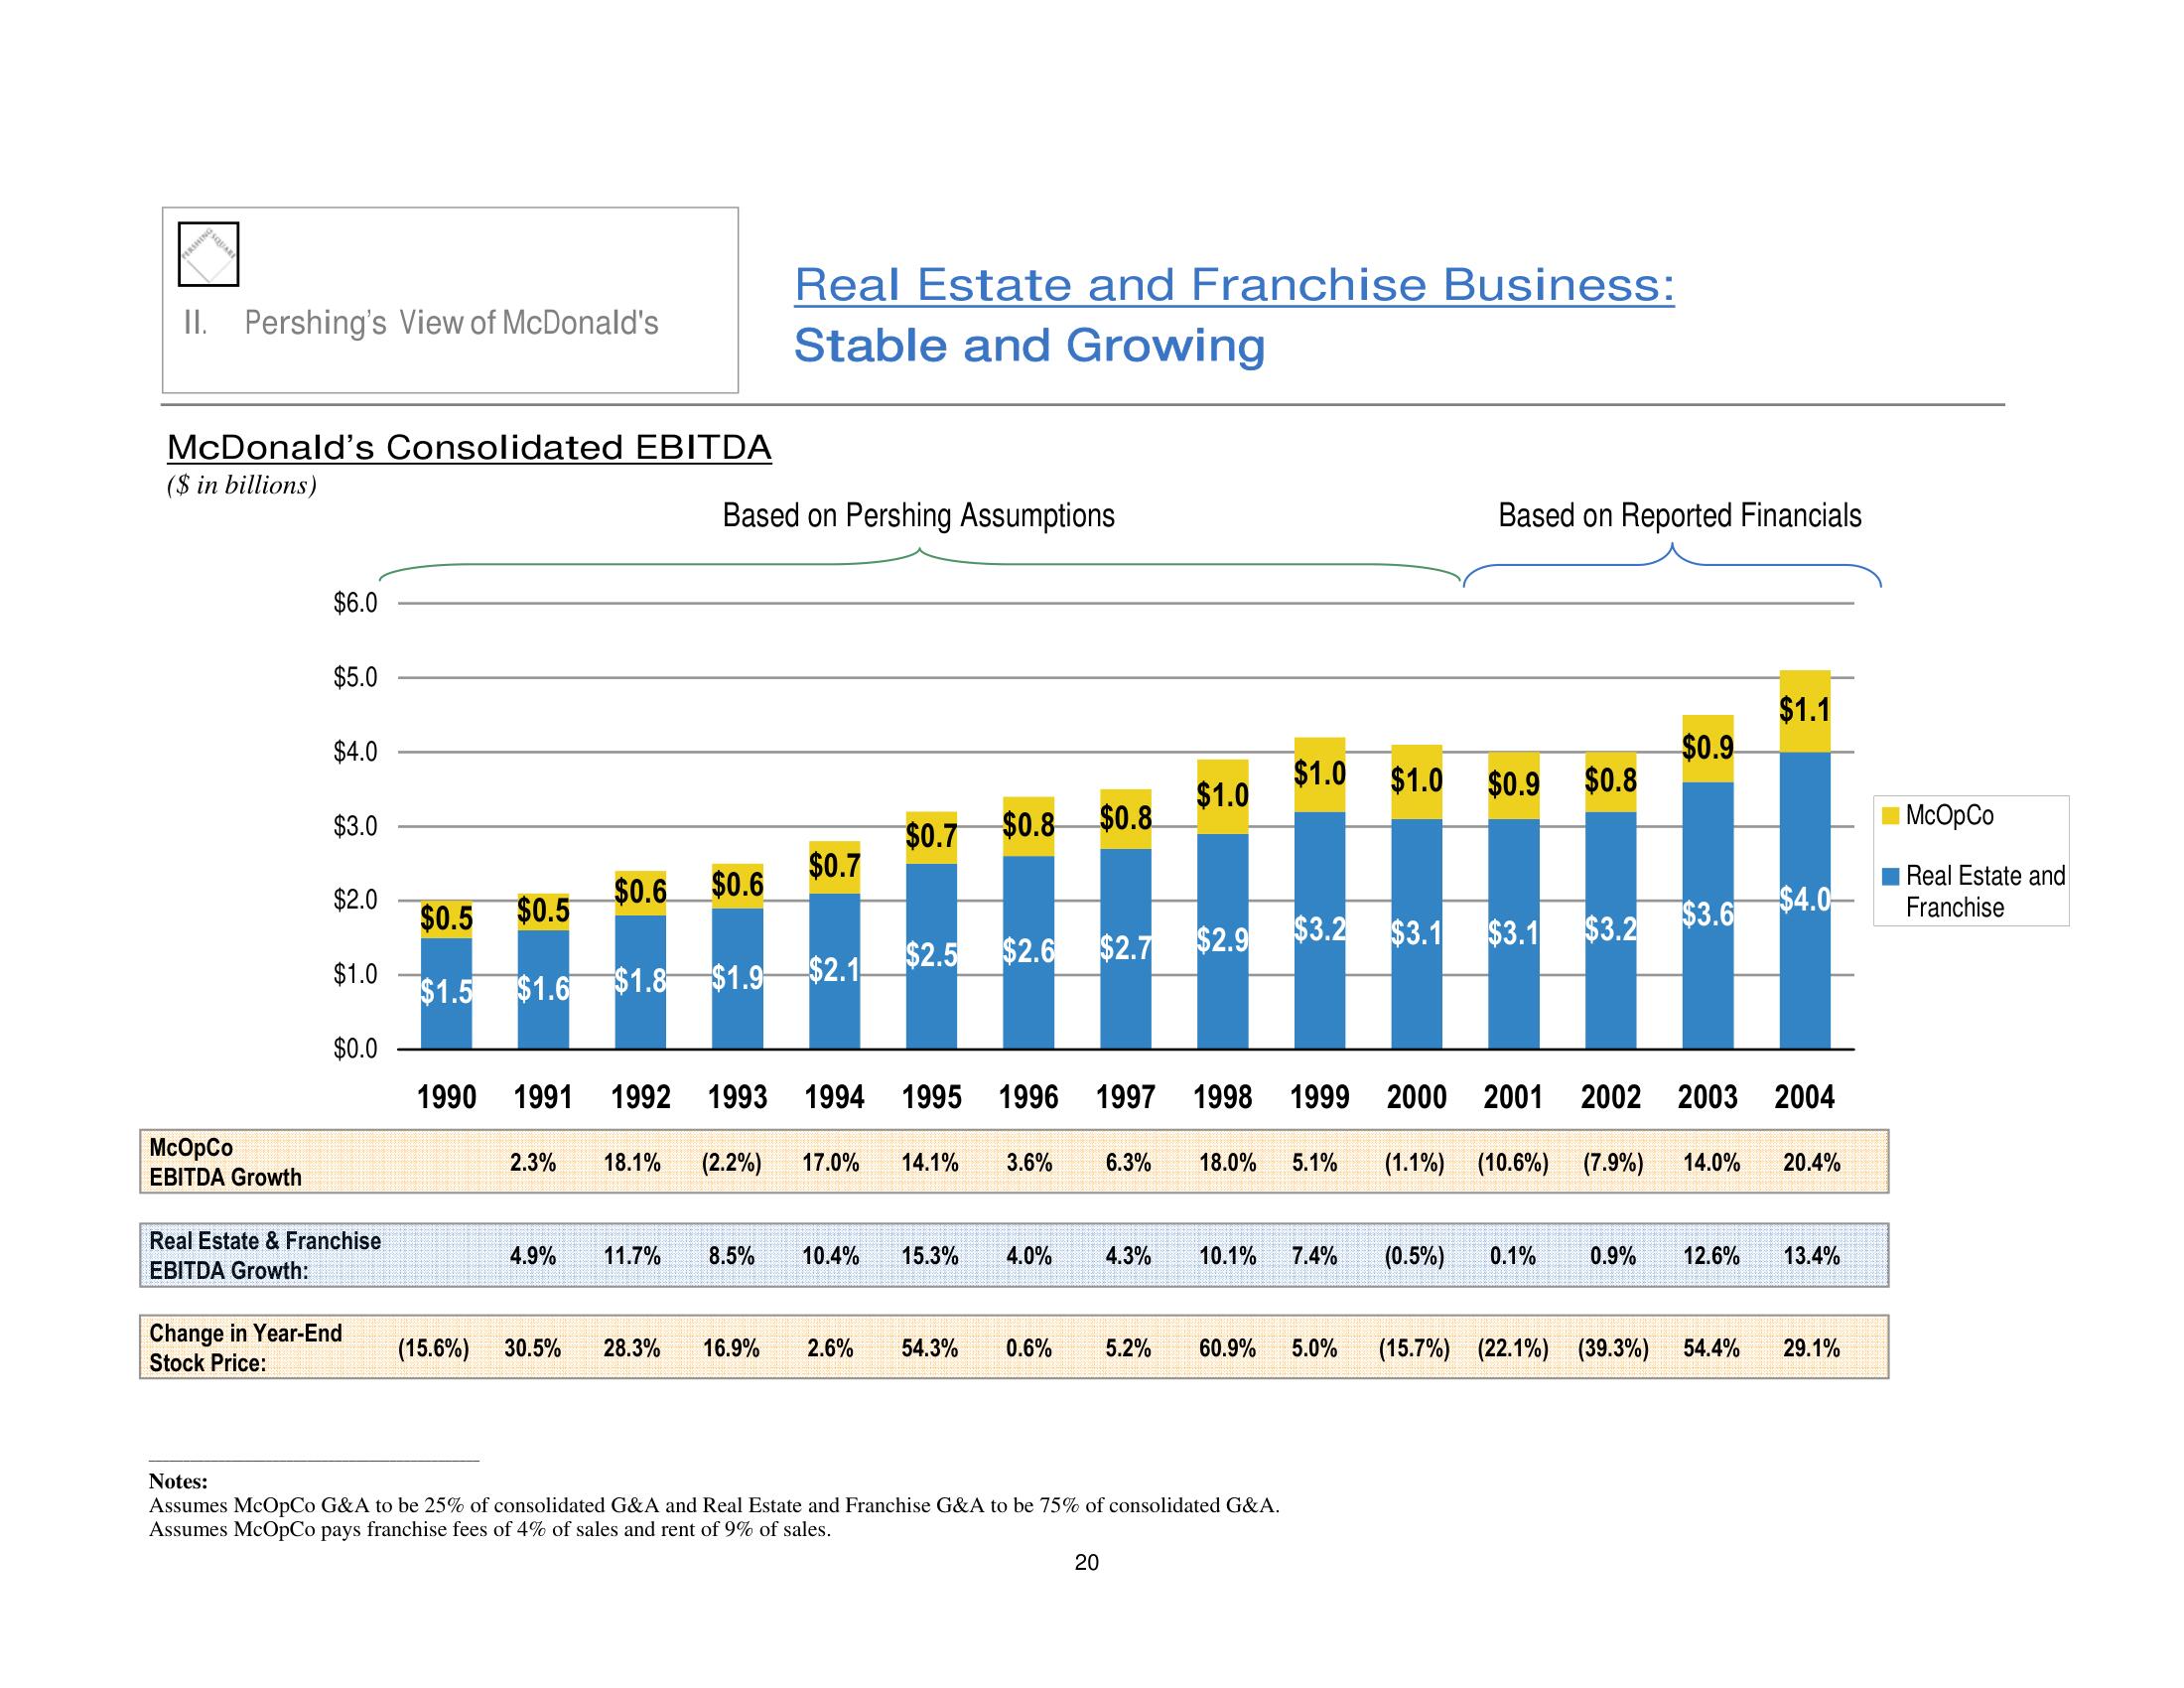
McDonald's Consolidated EBITDA
($ in billions)
McOpCo
EBITDA Growth
$6.0
$5.0
$4.0
$3.0
$2.0
$1.0
$0.0
Real Estate & Franchise
EBITDA Growth:
Change in Year-End
Stock Price:
1990
(15.6%)
Based on Pershing Assumptions
$0.6 $0.6
$0.5
$0.5
$1.5 $1.6 $1.8 $1.9 $2.1
2.3%
Real Estate and Franchise Business:
Stable and Growing
$0.7
4.9% 11.7% 8.5%
$0.7
1991 1992 1993 1994 1995
$0.8 $0.8
$2.5 $2.6 $2.7 $2.9
1996
18.1% (2.2%) 17.0% 14.1% 3.6%
$1.0
10.4% 15.3% 4.0% 4.3%
$1.0
20
6.3% 18.0% 5.1%
Notes:
Assumes McOpCo G&A to be 25% of consolidated G&A and Real Estate and Franchise G&A to be 75% of consolidated G&A.
Assumes McOpCo pays franchise fees of 4% of sales and rent of 9% of sales.
10.1% 7.4%
30.5% 28.3% 16.9% 2.6% 54.3% 0.6% 5.2% 60.9% 5.0%
$1.0
$3.2 $3.1 $3.1 $3.2
Based on Reported Financials
$0.9 $0.8
1997 1998 1999 2000 2001 2002 2003 2004
(1.1%) (10.6%)
(7.9%) 14.0% 20.4%
$0.9
(0.5%) 0.1%
$3.6
$1.1
$4.0
(15.7%) (22.1%) (39.3%) 54.4%
0.9% 12.6% 13.4%
29.1%
McOpCo
Real Estate and
FranchiseView entire presentation