Bird SPAC Presentation Deck
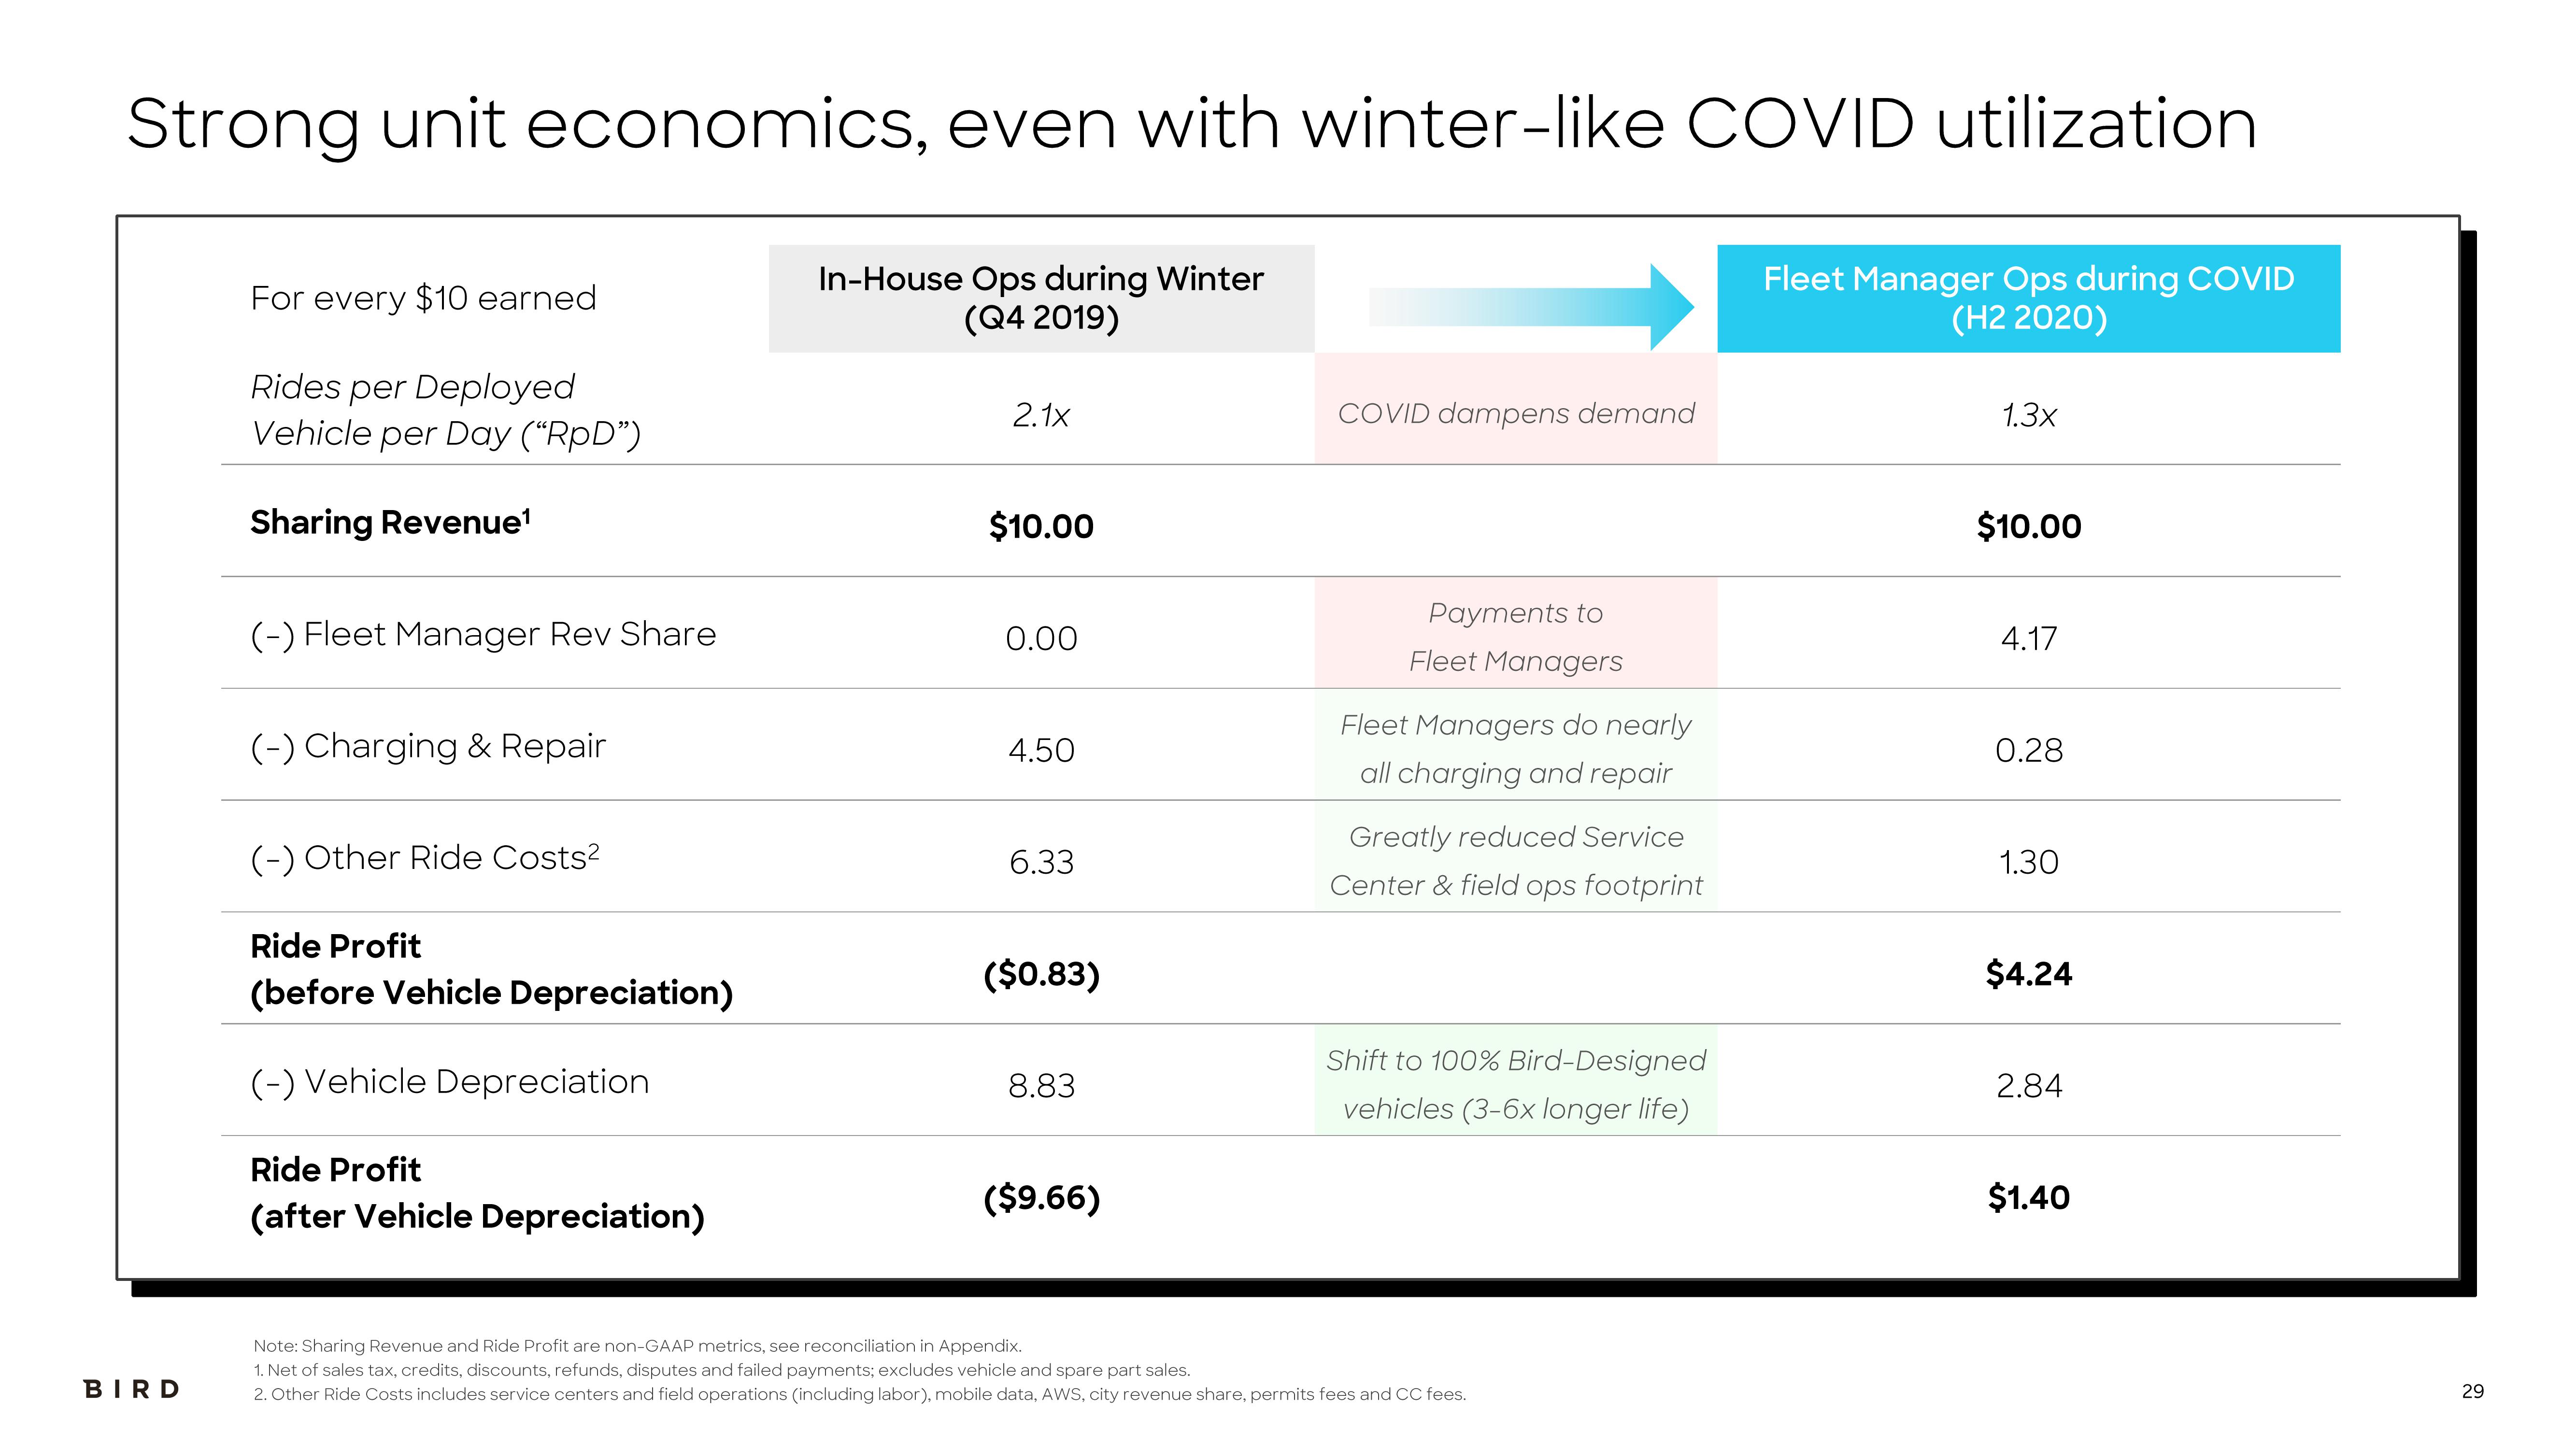
Strong unit economics, even with winter-like COVID utilization
In-House Ops during Winter
(Q4 2019)
Fleet Manager Ops during COVID
(H2 2020)
BIRD
For every $10 earned
Rides per Deployed
Vehicle per Day ("RpD")
Sharing Revenue¹
(-) Fleet Manager Rev Share
(-) Charging & Repair
(-) Other Ride Costs²
Ride Profit
(before Vehicle Depreciation)
(-) Vehicle Depreciation
Ride Profit
(after Vehicle Depreciation)
2.1x
$10.00
0.00
4.50
6.33
($0.83)
8.83
($9.66)
COVID dampens demand
Payments to
Fleet Managers
Fleet Managers do nearly
all charging and repair
Greatly reduced Service
Center & field ops footprint
Shift to 100% Bird-Designed
vehicles (3-6x longer life)
Note: Sharing Revenue and Ride Profit are non-GAAP metrics, see reconciliation in Appendix.
1. Net of sales tax, credits, discounts, refunds, disputes and failed payments; excludes vehicle and spare part sales.
2. Other Ride Costs includes service centers and field operations (including labor), mobile data, AWS, city revenue share, permits fees and CC fees.
1.3x
$10.00
4.17
0.28
1.30
$4.24
2.84
$1.40
29View entire presentation