Pathward Financial Results Presentation Deck
Non-GAAP Reconciliation
28
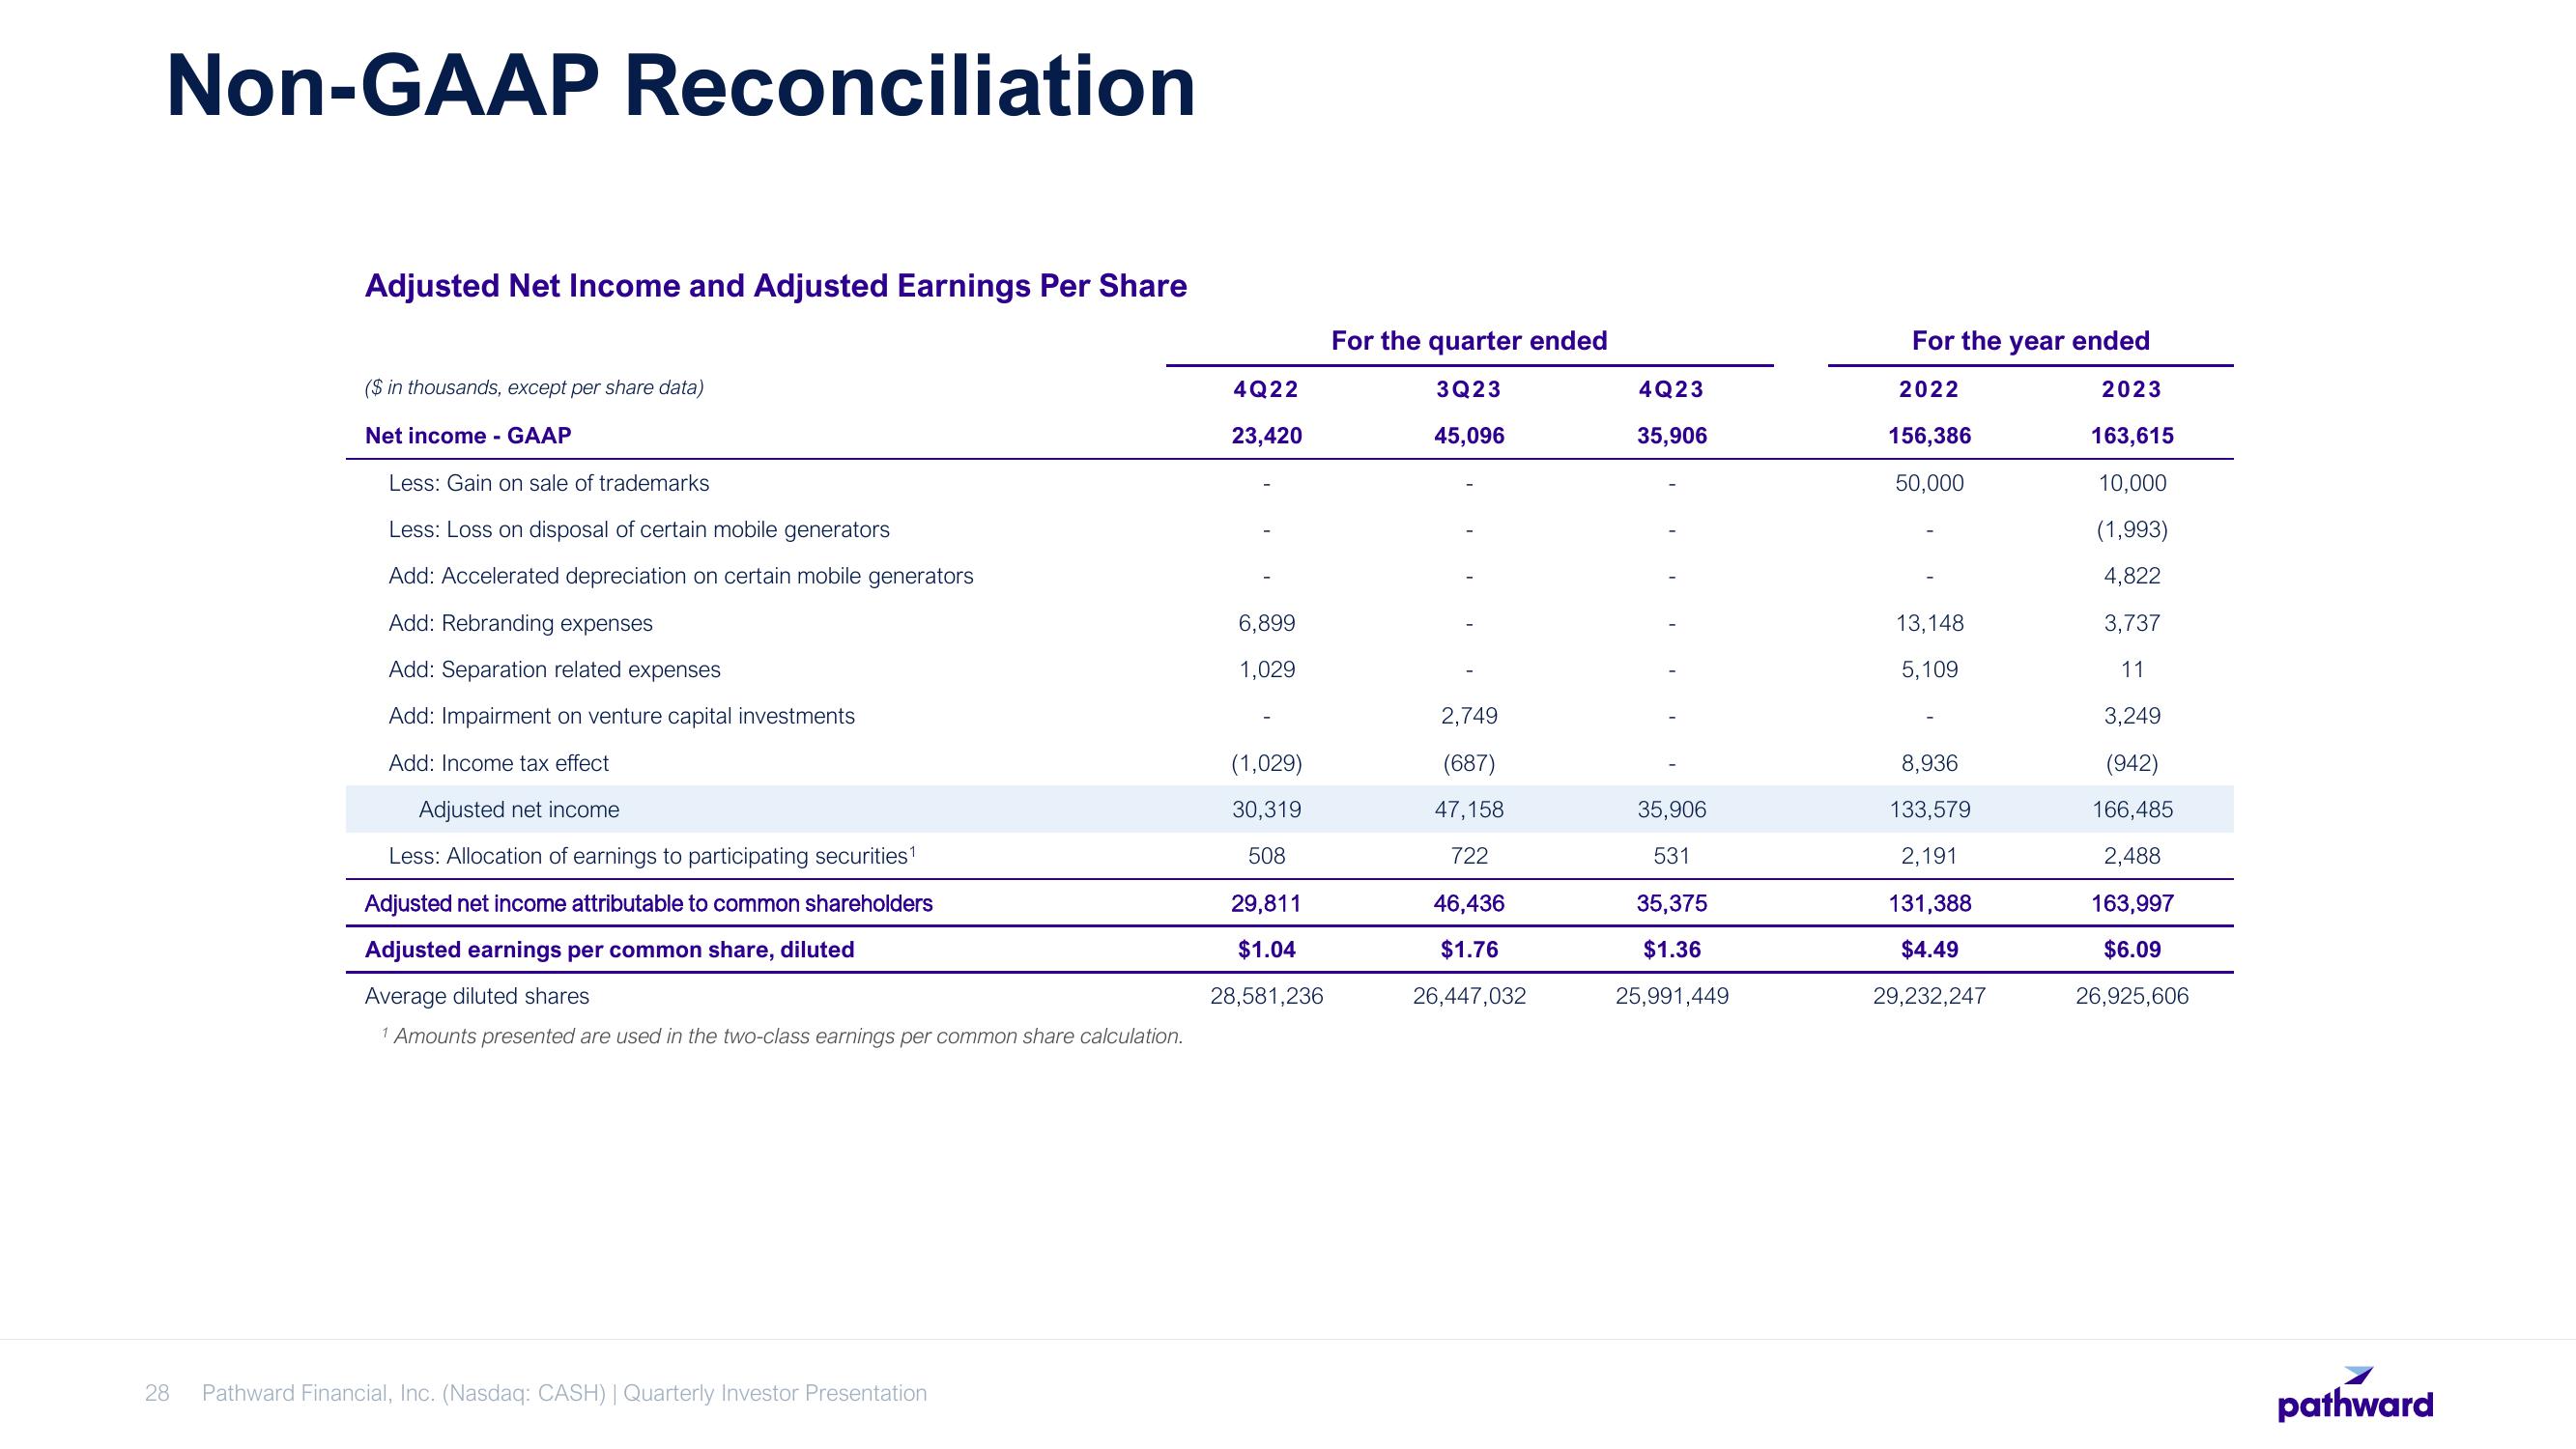
Adjusted Net Income and Adjusted Earnings Per Share
($ in thousands, except per share data)
Net income - GAAP
Less: Gain on sale of trademarks
Less: Loss on disposal of certain mobile generators
Add: Accelerated depreciation on certain mobile generators
Add: Rebranding expenses
Add: Separation related expenses
Add: Impairment on venture capital investments
Add: Income tax effect
Adjusted net income
Less: Allocation of earnings to participating securities¹
Adjusted net income attributable to common shareholders
Adjusted earnings per common share, diluted
Average diluted shares
1 Amounts presented are used in the two-class earnings per common share calculation.
Pathward Financial, Inc. (Nasdaq: CASH) | Quarterly Investor Presentation
4Q22
23,420
6,899
1,029
(1,029)
30,319
508
29,811
$1.04
28,581,236
For the quarter ended
3Q23
45,096
2,749
(687)
47,158
722
46,436
$1.76
26,447,032
4Q23
35,906
35,906
531
35,375
$1.36
25,991,449
For the year ended
2022
156,386
50,000
2023
163,615
10,000
(1,993)
4,822
3,737
11
3,249
(942)
166,485
2,488
163,997
$6.09
26,925,606
13,148
5,109
8,936
133,579
2,191
131,388
$4.49
29,232,247
pathwardView entire presentation