Pinterest Results Presentation Deck
Cost of Revenue
26%
$178
Q322
S&M
30%
$203
20%
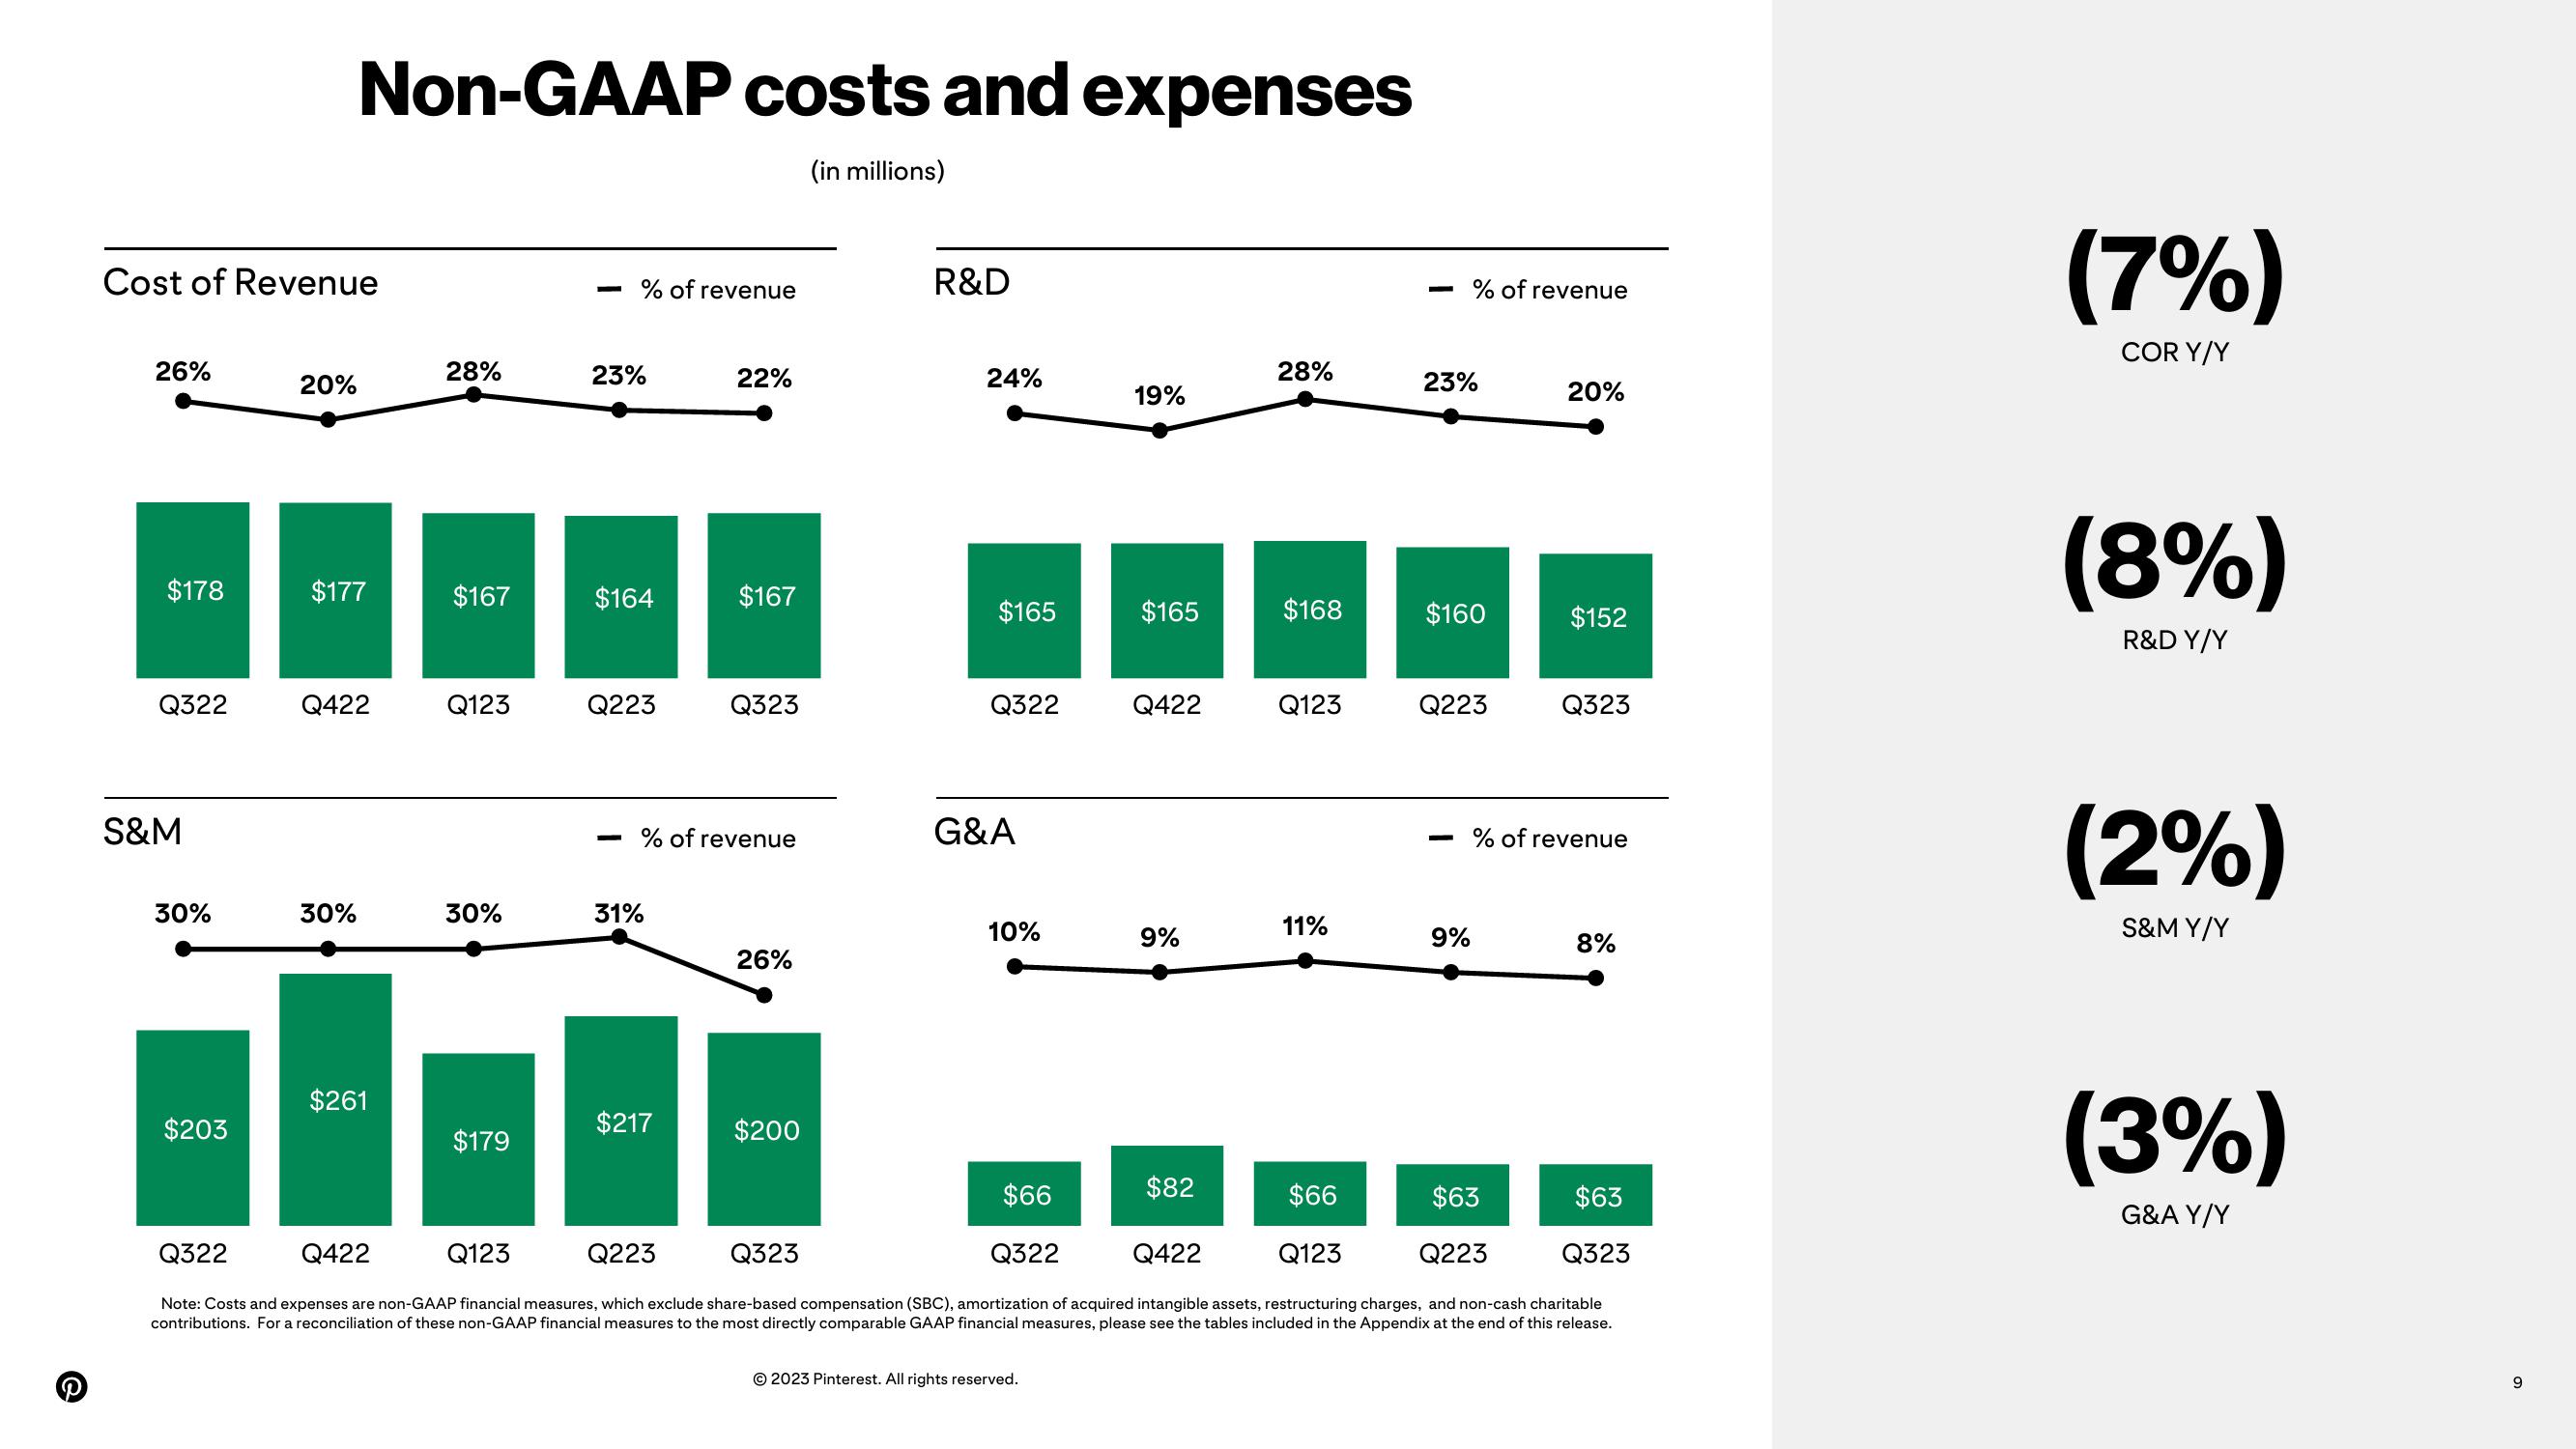
Non-GAAP costs and expenses
(in millions)
$177
Q422
30%
$261
28%
$167
Q123
30%
$179
% of revenue
23%
$164
Q223
-
31%
22%
$217
$167
% of revenue
Q323
26%
$200
R&D
24%
$165
Q322
G&A
10%
19%
© 2023 Pinterest. All rights reserved.
$165
Q422
9%
$82
28%
$168
Q123
11%
% of revenue
23%
$160
Q223
9%
20%
$152
Q323
% of revenue
8%
$63
Q323
$66
$66
$63
Q322
Q422
Q123
Q223
Q323
Q322
Q422
Q123
Q223
Note: Costs and expenses are non-GAAP financial measures, which exclude share-based compensation (SBC), amortization of acquired intangible assets, restructuring charges, and non-cash charitable
contributions. For a reconciliation of these non-GAAP financial measures to the most directly comparable GAAP financial measures, please see the tables included in the Appendix at the end of this release.
(7%)
COR Y/Y
(8%)
R&D Y/Y
(2%)
S&M Y/Y
(3%)
G&A Y/Y
9View entire presentation