J.P.Morgan Investment Banking Pitch Book
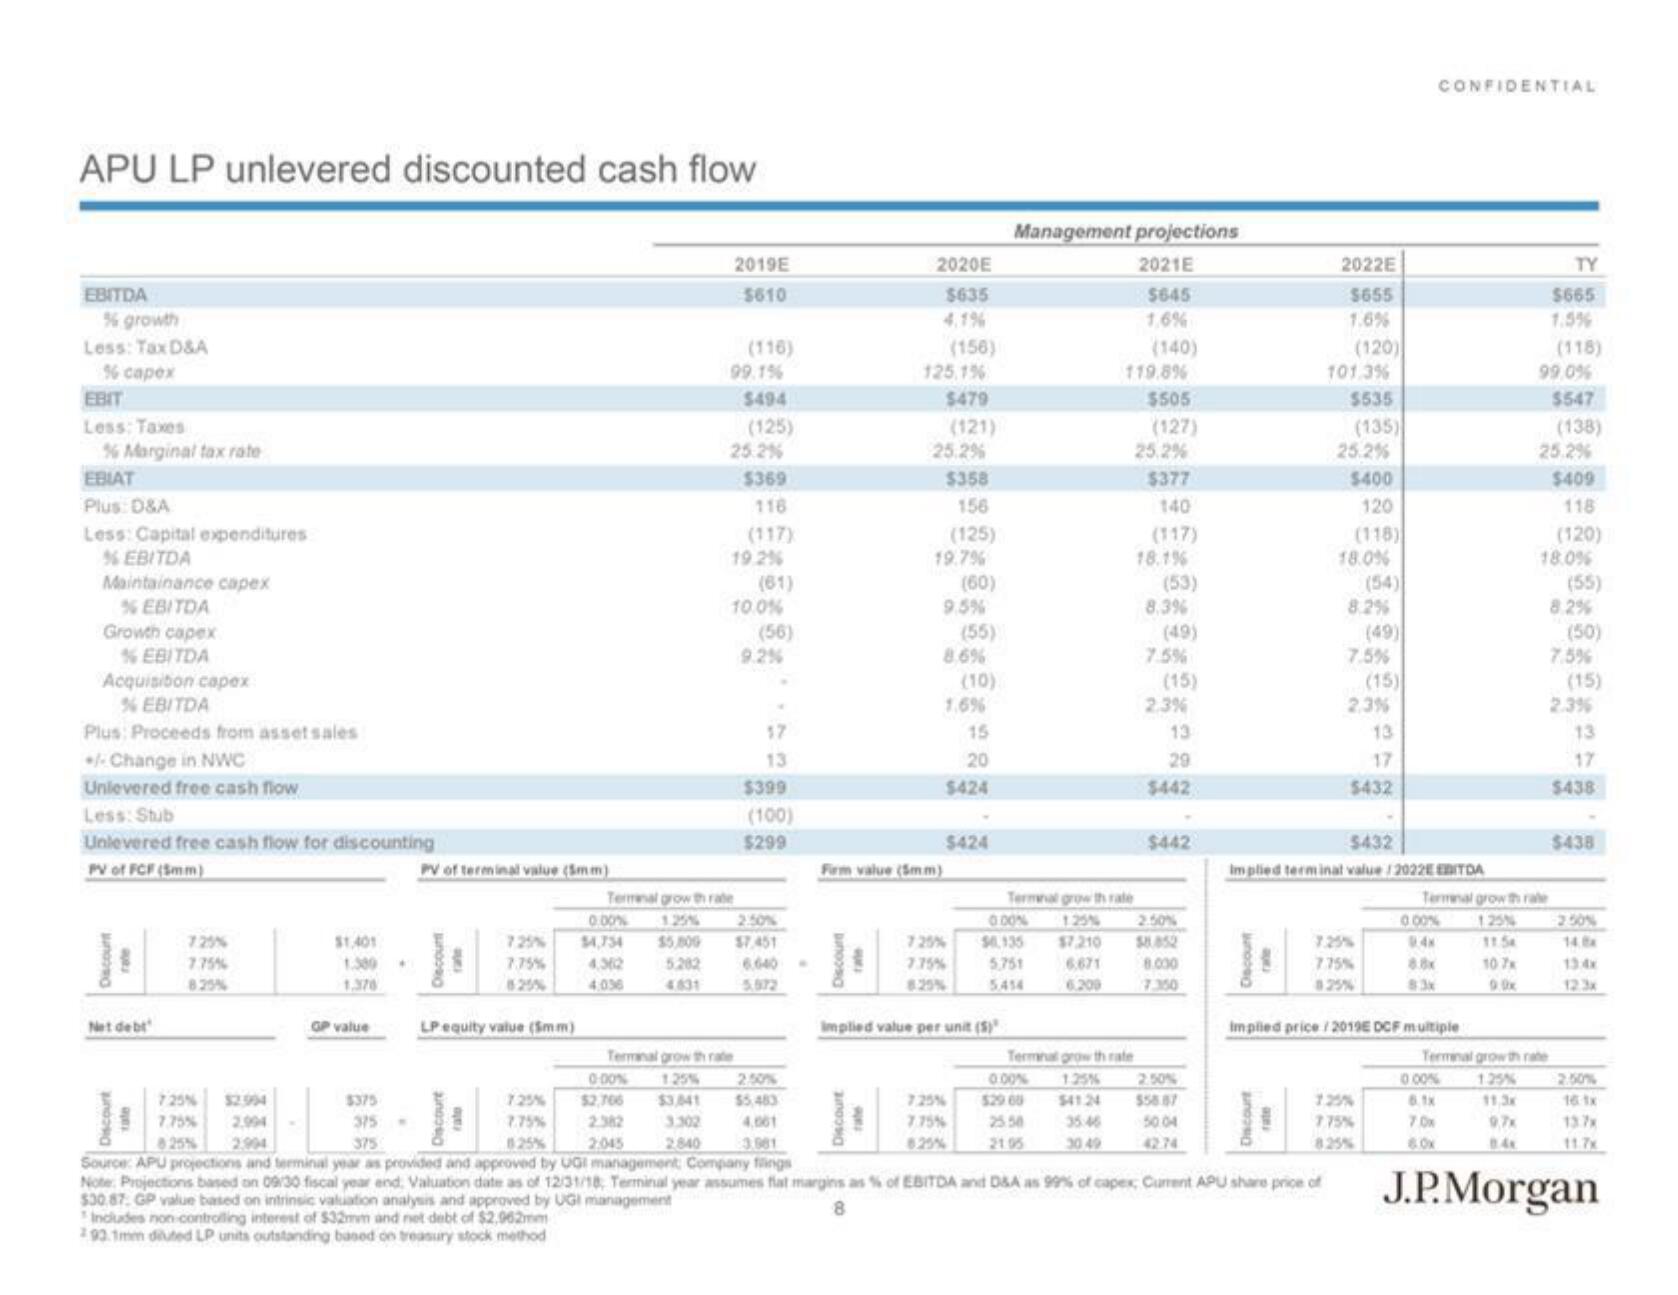
APU LP unlevered discounted cash flow
EBITDA
% growth
Less: Tax D&A
% capex
EBIT
Less: Taxes
% Marginal tax rate
EBIAT
Plus: D&A
Less: Capital expenditures
%EBITDA
Maintainance capex
%EBITDA
Growth capex
%EBITDA
Acquisition capex
%EBITDA
Plus: Proceeds from asset sales
+/- Change in NWC
Unlevered free cash flow
Less: Stub
Unlevered free cash flow for discounting
PV of FCF (5mm)
Net debt
7.25%
8.25%
7.75%
825%
$1,401
1.300
1.376
GP value
$375
PV of terminal value (5mm)
rate
LP equity value (5mm)
Discourt
7.25%
7.75%
825%
0.00%
$4,754
4,362
4.036
2019E
5610
5.202
4831
99.1%
(116)
Terminal growth rate
25.2%
$494
(125)
19.2%
Terminal grow th rate
$369
116
10.0%
(61)
(56)
9.2%
17
13
$399
(100)
$299
2.50%
$7.451
6.640
5.972
0.00%
2.50%
$2,706 $3,841 $5,483
2.382
3.302
4,061
2,840
3.901
2020E
$635
125,1%
$479
(121)
25.2%
$358
156
(125)
(156)
19.7%
9.5%
Firm value (5mm)
(60)
8.6%
7.35%
(55)
1.6%
(10)
7.25%
7.75%
15
20
$424
$424
Implied value per unit (S)
Management projections
2021E
$645
1,6%
0.00%
$4,135
5,751
5414
Terminal growth rale
0.00%
25.50
21.05
119.8%
Terminal grow th rate
125%
541.24
(140)
25.2%
30 49
$505
(127)
$377
140
(117)
18.1%
(53)
8.3%
7.5%
(15)
2.3%
13
29
$442
2.50%
$7,210 $8.852
6.671
8.000
6.200
7.350
$442
2.50%
$58.87
50.04
42.74
2022E
$655
1.6%
Discourt
(120)
101.3%
375-
375
Source: APU projections and terminal year as provided and approved by UGI management Company filings
Note: Projections based on 09/30 fiscal year end. Valuation date as of 12/31/18, Terminal year assumes fiat margins as % of EBITDA and D&A as 99% of capex, Current APU share price of
$30.87. GP value based on intrinsic valuation analysis and approved by UGI management
8
Includes non-controlling interest of $32mm and net debt of $2,962mm
293.1mm diluted LP units outstanding based on treasury stock method
$535
(135)
25.2%
$400
120
(118)
18.0%
8.2%
7.5%
(49)
2.3%
7.75%
(15)
13
17
$432
$432
Implied terminal value/2022E EBITDA
7.25%
7.75%
CONFIDENTIAL
Impiled price/2019E DCF multiple
000%
9.4x
0.00%
6.1x
7.0x
10 7x
90x
TY
$665
1.5%
99,0%
$547
(138)
25.2%
Terminal growth rale
125%
11.5k
(118)
Terminal growth rate
125%
11,3x
9,7x
8.4
$409
118
18.0%
(120)
(55)
8.2%
7.5%
(50)
2.3%
(15)
13
$438
$438
2.50%
14.8
13:4x
16 1x
11.7x
J.P. MorganView entire presentation