AstraZeneca Results Presentation Deck
Total Revenue ($m)
5,000
4,500
4,000
3,500
3,000
2,500
2,000
1,500
1,000
500
0
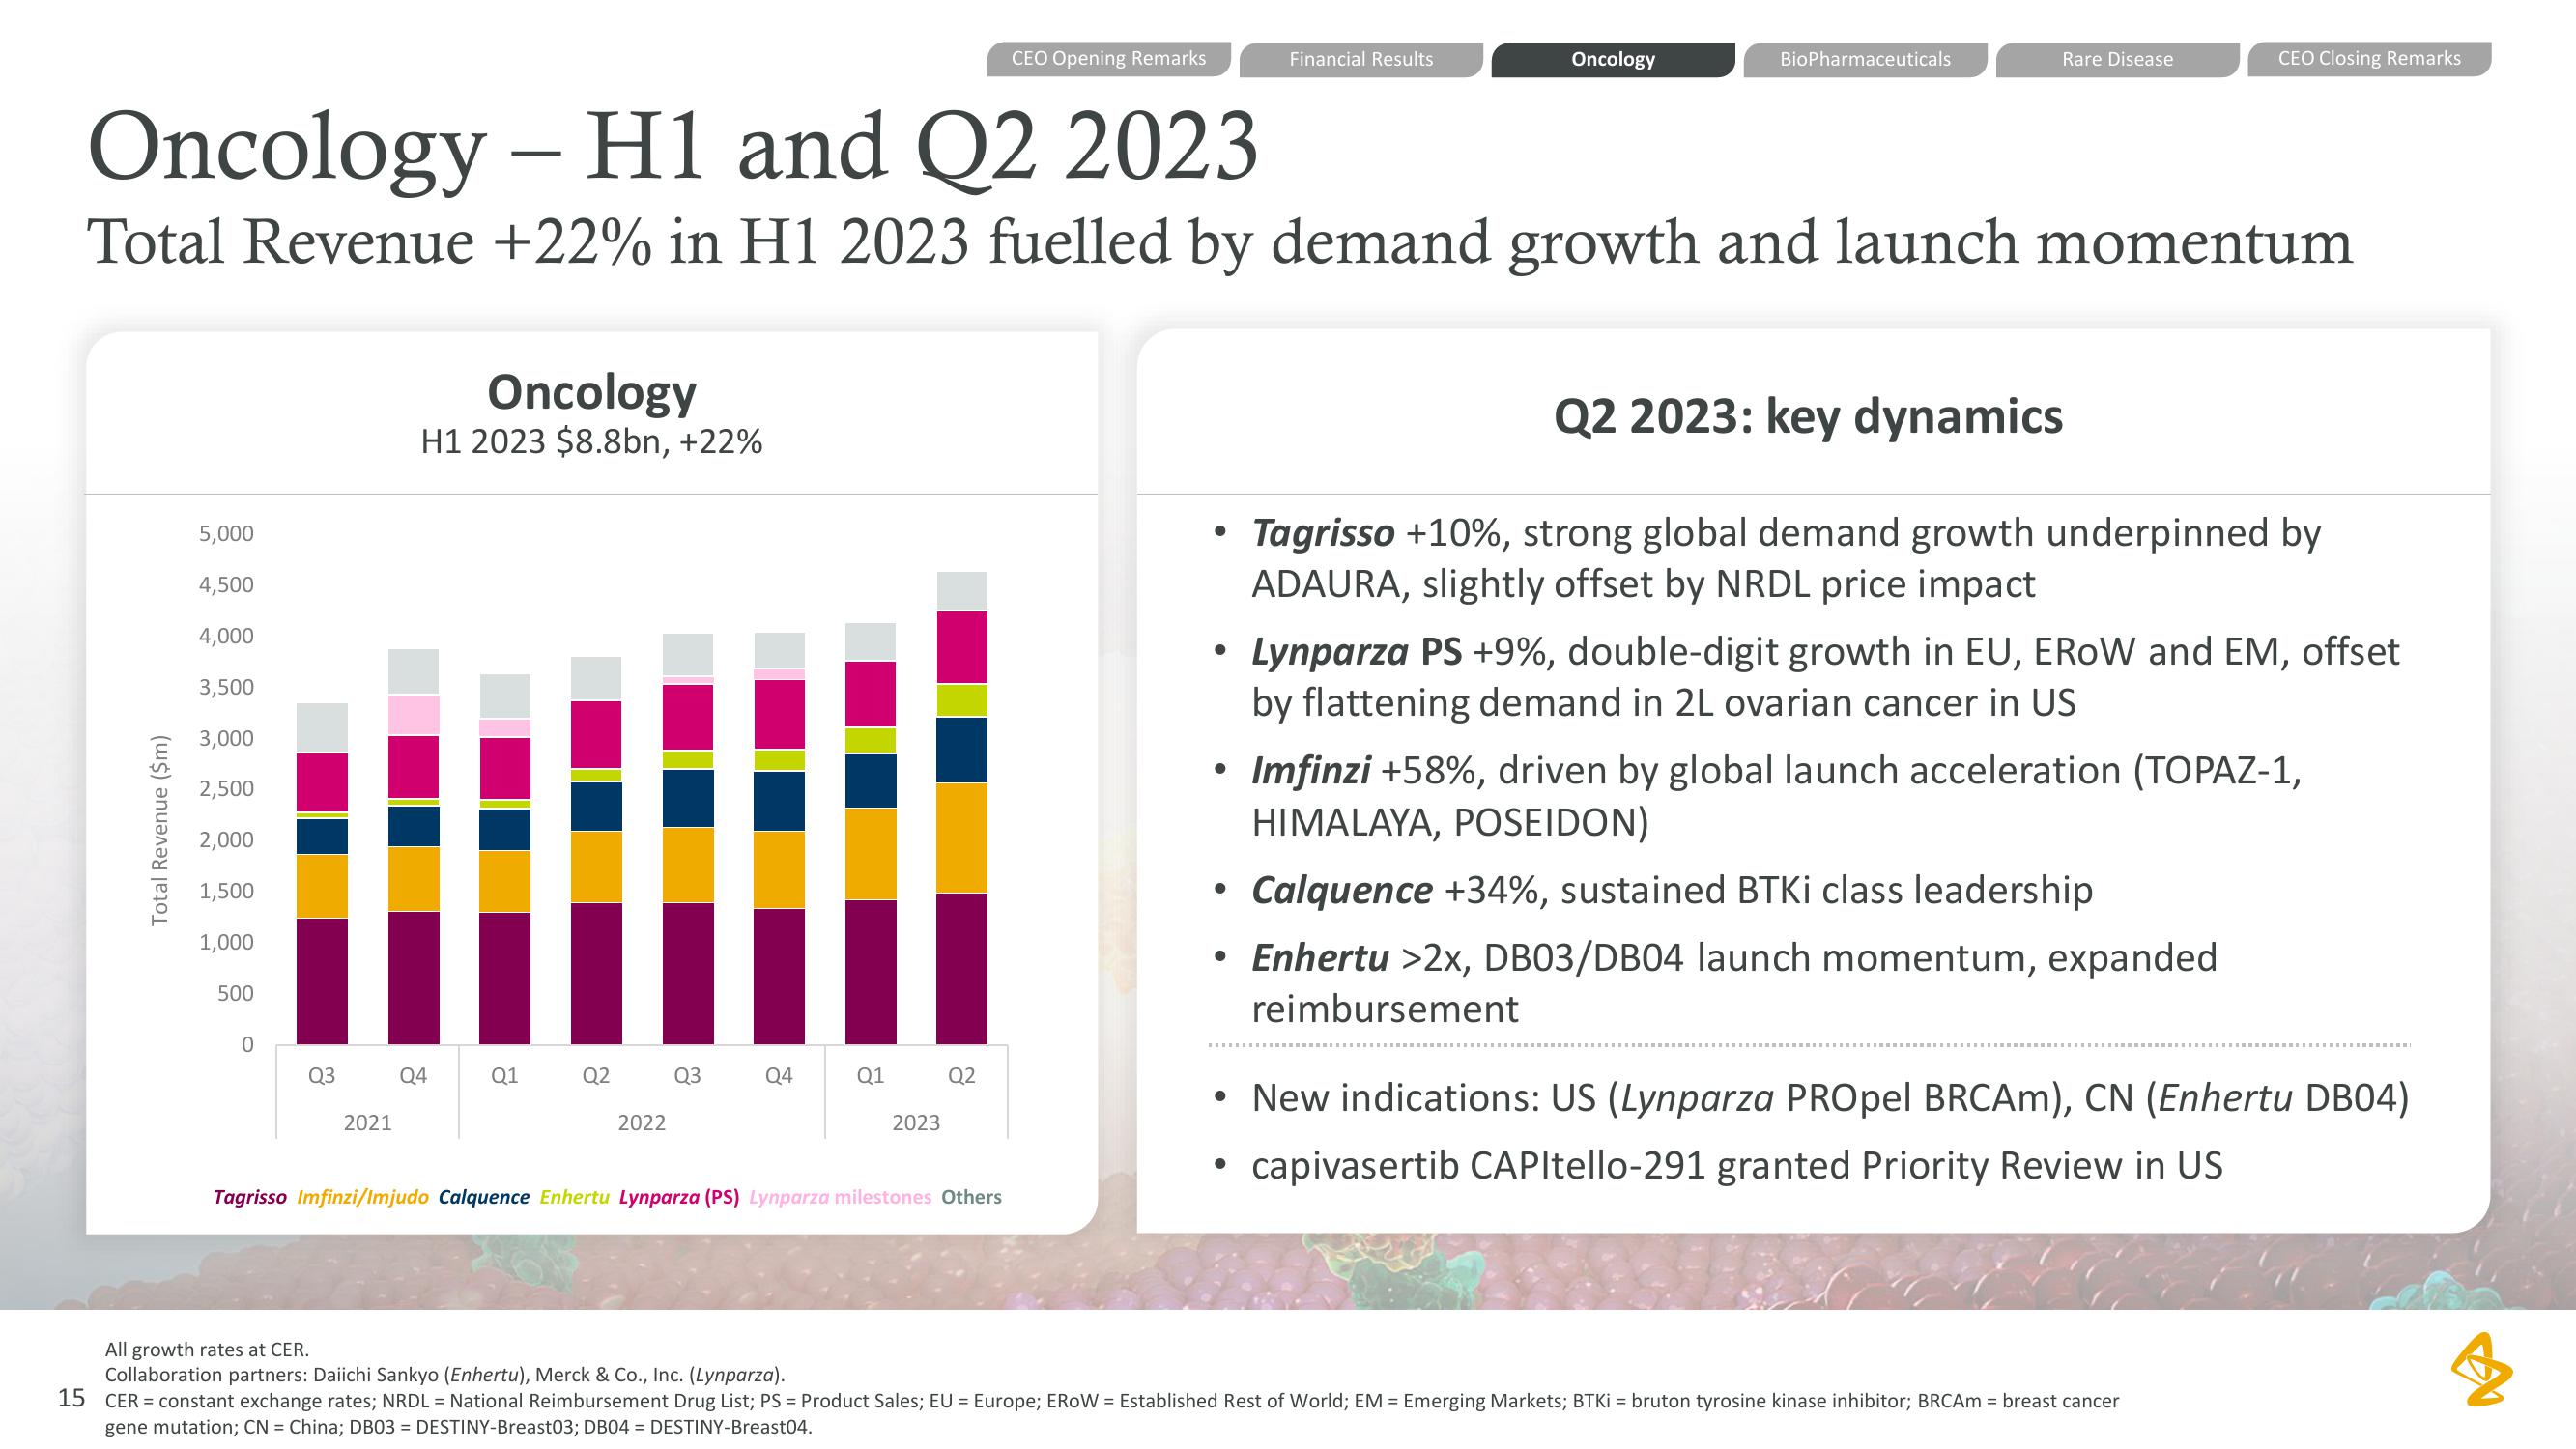
Oncology - H1 and Q2 2023
Total Revenue +22% in H1 2023 fuelled by demand growth and launch momentum
Q3
2021
Oncology
H1 2023 $8.8bn, +22%
Q4
Q1
Q2
2022
Q3
Q4
Q1
2023
Q2
CEO Opening Remarks
Tagrisso Imfinzi/Imjudo Calquence Enhertu Lynparza (PS) Lynparza milestones Others
●
●
●
●
●
●
Financial Results
●
Oncology
BioPharmaceuticals
Rare Disease
Q2 2023: key dynamics
CEO Closing Remarks
Tagrisso +10%, strong global demand growth underpinned by
ADAURA, slightly offset by NRDL price impact
Lynparza PS +9%, double-digit growth in EU, EROW and EM, offset
by flattening demand in 2L ovarian cancer in US
Imfinzi +58%, driven by global launch acceleration (TOPAZ-1,
HIMALAYA, POSEIDON)
Calquence +34%, sustained BTKI class leadership
Enhertu >2x, DB03/DB04 launch momentum, expanded
reimbursement
New indications: US (Lynparza PROpel BRCAm), CN (Enhertu DB04)
capivasertib CAPItello-291 granted Priority Review in US
All growth rates at CER.
Collaboration partners: Daiichi Sankyo (Enhertu), Merck & Co., Inc. (Lynparza).
15 CER = constant exchange rates; NRDL= National Reimbursement Drug List; PS = Product Sales; EU = Europe; EROW= Established Rest of World; EM = Emerging Markets; BTKi = bruton tyrosine kinase inhibitor; BRCAm = breast cancer
gene mutation; CN = China; DB03 = DESTINY-Breast03; DB04 = DESTINY-Breast04.
4View entire presentation