Silicon Valley Bank Results Presentation Deck
Non-GAAP reconciliation*
Noninterest income
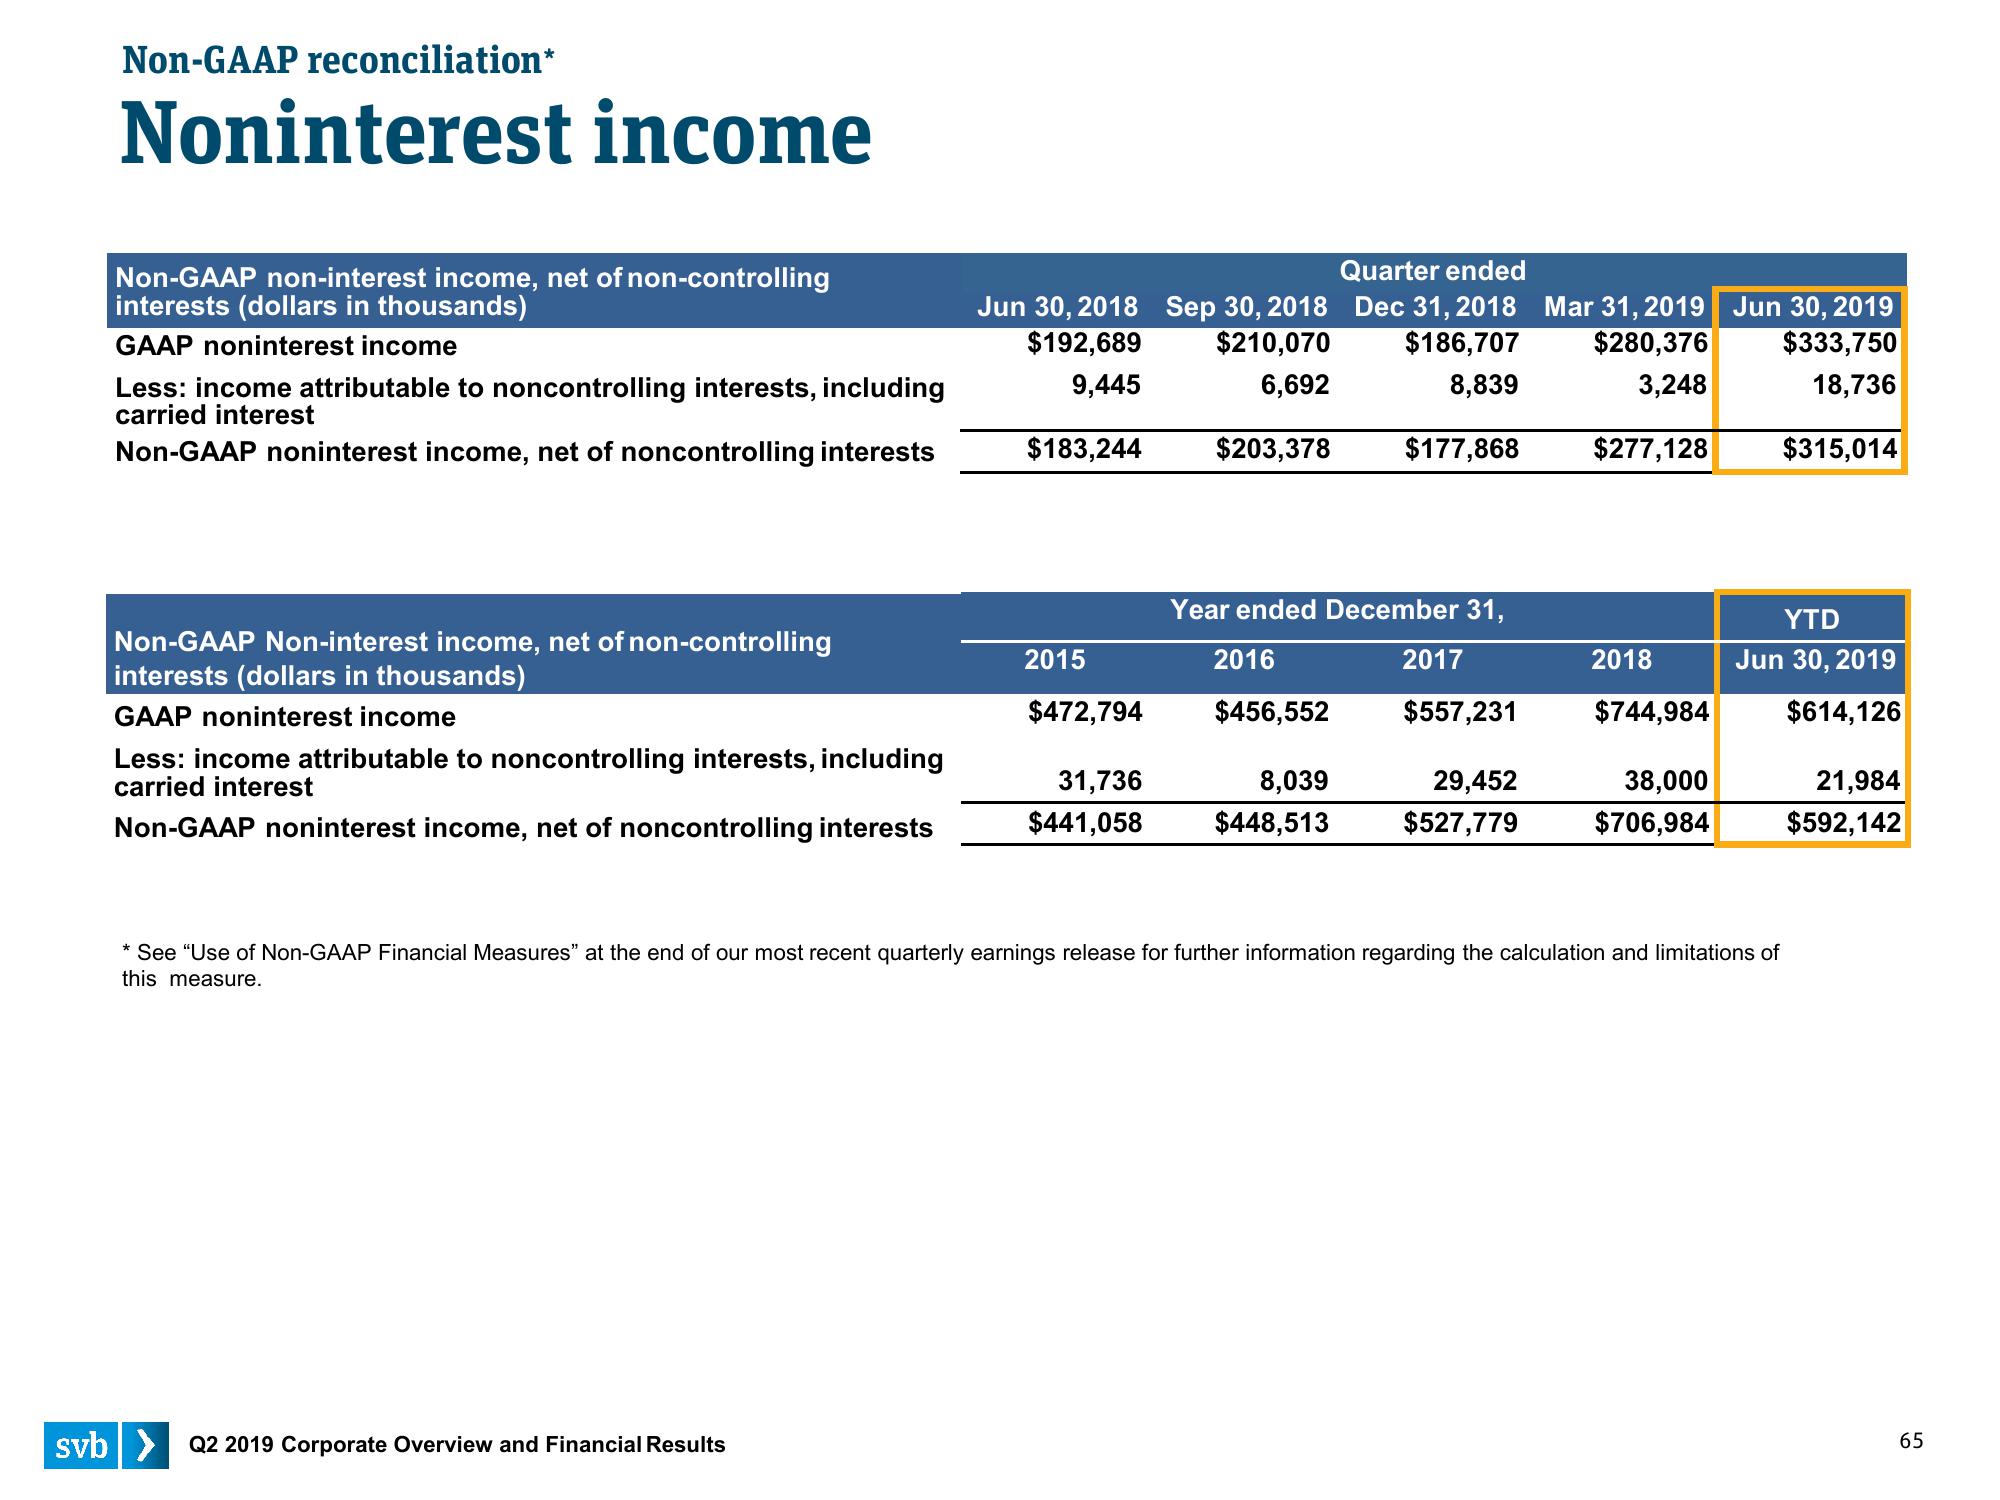
Non-GAAP non-interest income, net of non-controlling
interests (dollars in thousands)
GAAP noninterest income
Less: income attributable to noncontrolling interests, including
carried interest
Non-GAAP noninterest income, net of noncontrolling interests
Non-GAAP Non-interest income, net of non-controlling
interests (dollars in thousands)
GAAP noninterest income
Less: income attributable to noncontrolling interests, including
carried interest
Non-GAAP noninterest income, net of noncontrolling interests
Jun 30, 2018 Sep 30, 2018
$192,689
$210,070
9,445
6,692
svb> Q2 2019 Corporate Overview and Financial Results
$183,244
2015
$472,794
31,736
$441,058
$203,378
Quarter ended
Dec 31, 2018
$186,707
8,839
$177,868
Year ended December 31,
2016
$456,552
8,039
$448,513
2017
$557,231
29,452
$527,779
Mar 31, 2019
$280,376
3,248
$277,128
2018
$744,984
38,000
$706,984
Jun 30, 2019
$333,750
18,736
$315,014
YTD
Jun 30, 2019
$614,126
* See "Use of Non-GAAP Financial Measures" at the end of our most recent quarterly earnings release for further information regarding the calculation and limitations of
this measure.
21,984
$592,142
65View entire presentation