Boxed SPAC Presentation Deck
Model Overview
COMMENTARY
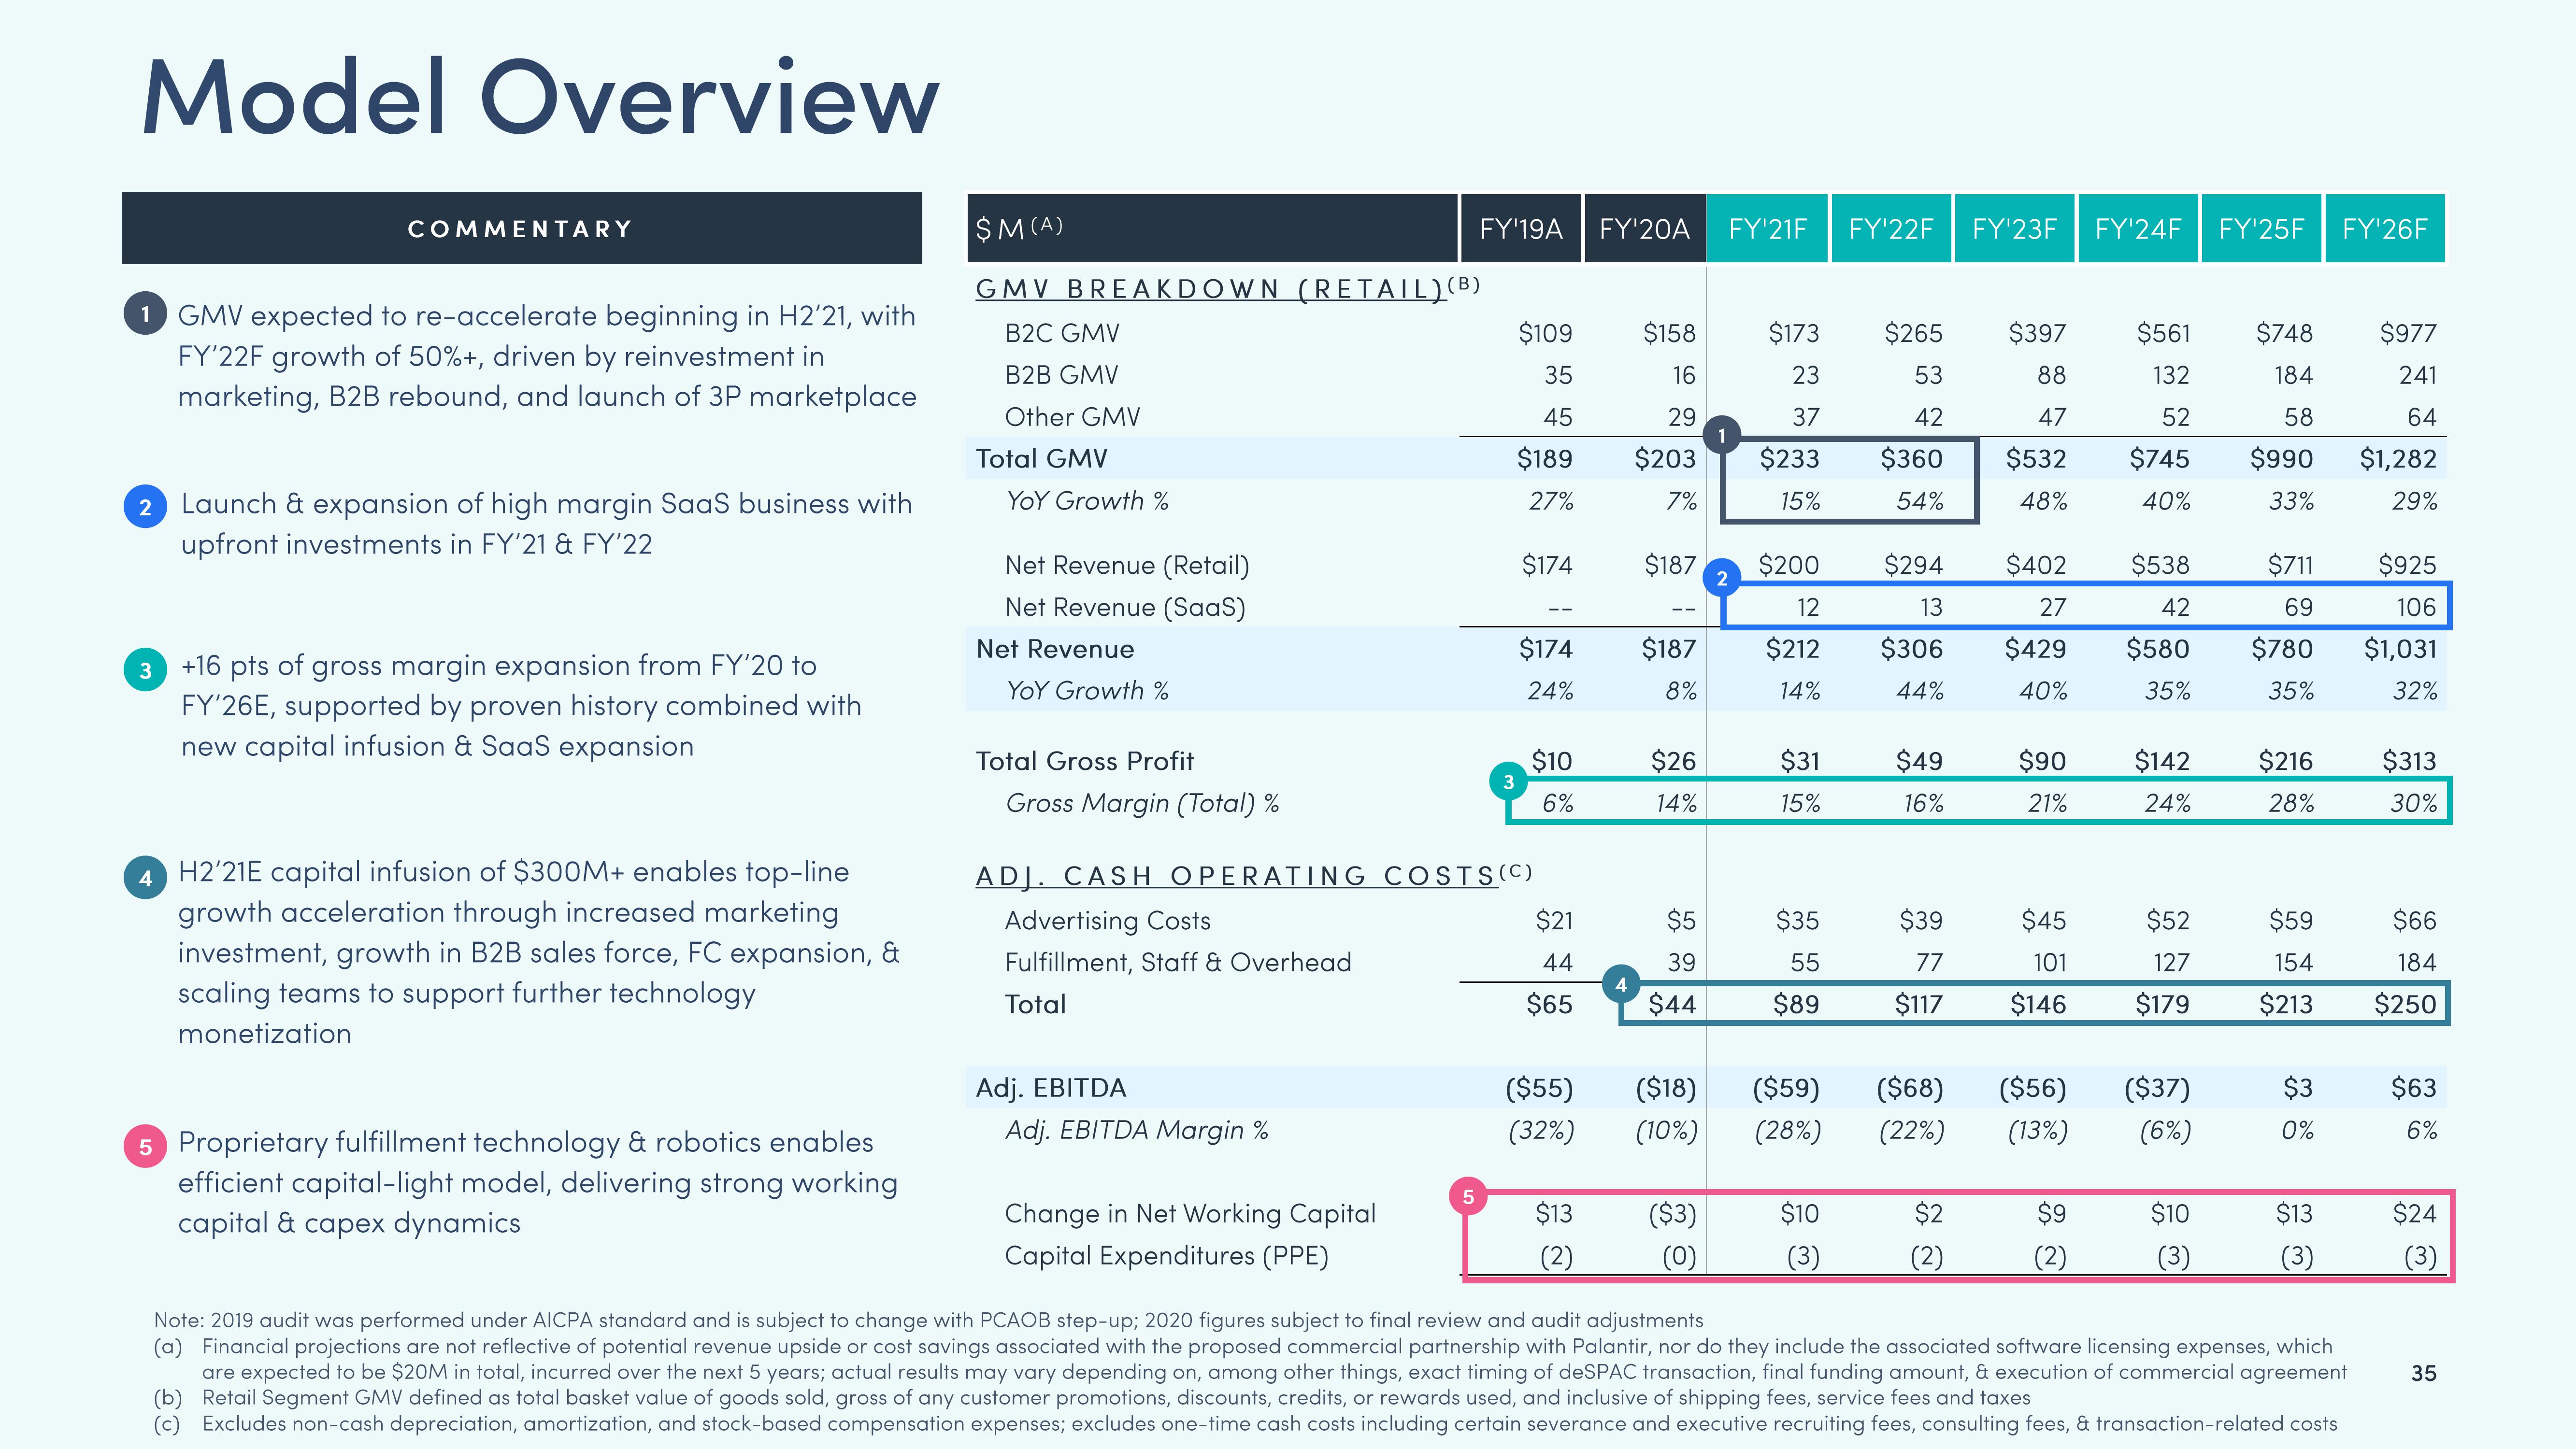
1 GMV expected to re-accelerate beginning in H2'21, with
FY'22F growth of 50%+, driven by reinvestment in
marketing, B2B rebound, and launch of 3P marketplace
2 Launch & expansion of high margin SaaS business with
upfront investments in FY'21 & FY'22
3 +16 pts of gross margin expansion from FY'20 to
FY'26E, supported by proven history combined with
new capital infusion & SaaS expansion
4
H2'21E capital infusion of $300M+ enables top-line
growth acceleration through increased marketing
investment, growth in B2B sales force, FC expansion, &
scaling teams to support further technology
monetization
5 Proprietary fulfillment technology & robotics enables
efficient capital-light model, delivering strong working
capital & capex dynamics
$M(A)
GMV BREAKDOWN (RETAIL) (B)
B2C GMV
B2B GMV
Other GMV
Total GMV
YOY Growth %
Net Revenue (Retail)
Net Revenue (SaaS)
Net Revenue
YOY Growth %
Total Gross Profit
Gross Margin (Total) %
Adj. EBITDA
Adj. EBITDA Margin %
Change in Net Working Capital
Capital Expenditures (PPE)
FY'19A
5
$109
35
45
$189
27%
3
ADJ. CASH OPERATING COSTS (C)
Advertising Costs
Fulfillment, Staff & Overhead
Total
$174
$174
24%
$10
6%
$21
44
$65
FY'20A
$13
(2)
$158
$173
23
37
$203 $233
16
29
7%
15%
$187
$187
8%
$26
14%
FY¹21F FY¹22F FY¹23F FY¹24F FY'25F FY¹26F
$5
39
$44
$200
12
$212
14%
$31
15%
$35
55
$89
($55) ($18) ($59)
(32%)
(10%)
(28%)
($3) $10
(0)
$265
53
42
$360
54%
$294
13
$306
44%
$49
16%
($68)
(22%)
$397
88
47
$532
48%
$2
$402
27
$429
40%
$39
$45
77
101
$117 $146
$90
21%
($56)
(13%)
$9
$561
132
52
$745
40%
$538
42
$580
35%
$142
24%
$52
127
$179
($37)
(6%)
$10
(3)
$748
184
58
$990
33%
69
$780
35%
$711 $925
106
$59
154
$213
$3
0%
$977
241
64
$216 $313
28%
30%
$13
(3)
$1,282
29%
Note: 2019 audit was performed under AICPA standard and is subject to change with PCAOB step-up; 2020 figures subject to final review and audit adjustments
(a) Financial projections are not reflective of potential revenue upside or cost savings associated with the proposed commercial partnership with Palantir, nor do they include the associated software licensing expenses, which
are expected to be $20M in total, incurred over the next 5 years; actual results may vary depending on, among other things, exact timing of deSPAC transaction, final funding amount, & execution of commercial agreement
(b) Retail Segment GMV defined as total basket value of goods sold, gross of any customer promotions, discounts, credits, or rewards used, and inclusive of shipping fees, service fees and taxes
(c) Excludes non-cash depreciation, amortization, and stock-based compensation expenses; excludes one-time cash costs including certain severance and executive recruiting fees, consulting fees, & transaction-related costs
$1,031
32%
$66
184
$250
$63
6%
$24
(3)
35View entire presentation