HSBC Results Presentation Deck
Corporate Centre
4021 financial highlights
$(109)m
$(4)m
$136m
$659m
Revenue
ECL
Costs
Associates
PBT
ROTE4⁹
679
46
150
Associate income detail, $m
483
4Q20
882
38
$682m
711
5.6%
133
1Q21
775
102
20
653
2Q21
Bank of Communications
[66
22%
(4020: $(139)m)
>(100)%
(4020: $1m)
>100%
(4020: $(885)m)
(3)%
(4020: $679m)
SABB
>100%
(4020: $(344)m)
711
2.5ppt
(FY20: 3.1%)
100
545
3Q21
(7)%
659
70
15
574
4021
Others
Revenue performance, $m
Central Treasury
Legacy Credit
Other
Total
Not included in Corporate Centre revenue: Markets
Treasury revenue allocated to global businesses
Adjusted RWAS 56, $bn
(0)%
91
39
52
4020
86
33
53
3Q21
Associates
6%
91
Other
38
53
4Q21
Strategy
4Q20
(12)
3
(130)
(139)
596
1Q21
(28)
9
(15)
(34)
4021 results
788
2Q21
(27)
6
(60)
(81)
504
Appendix
3Q21
(35)
(35)
(120)
(190)
518
4Q21
(9)
(14)
(86)
(109)
4021 vs. 4Q20
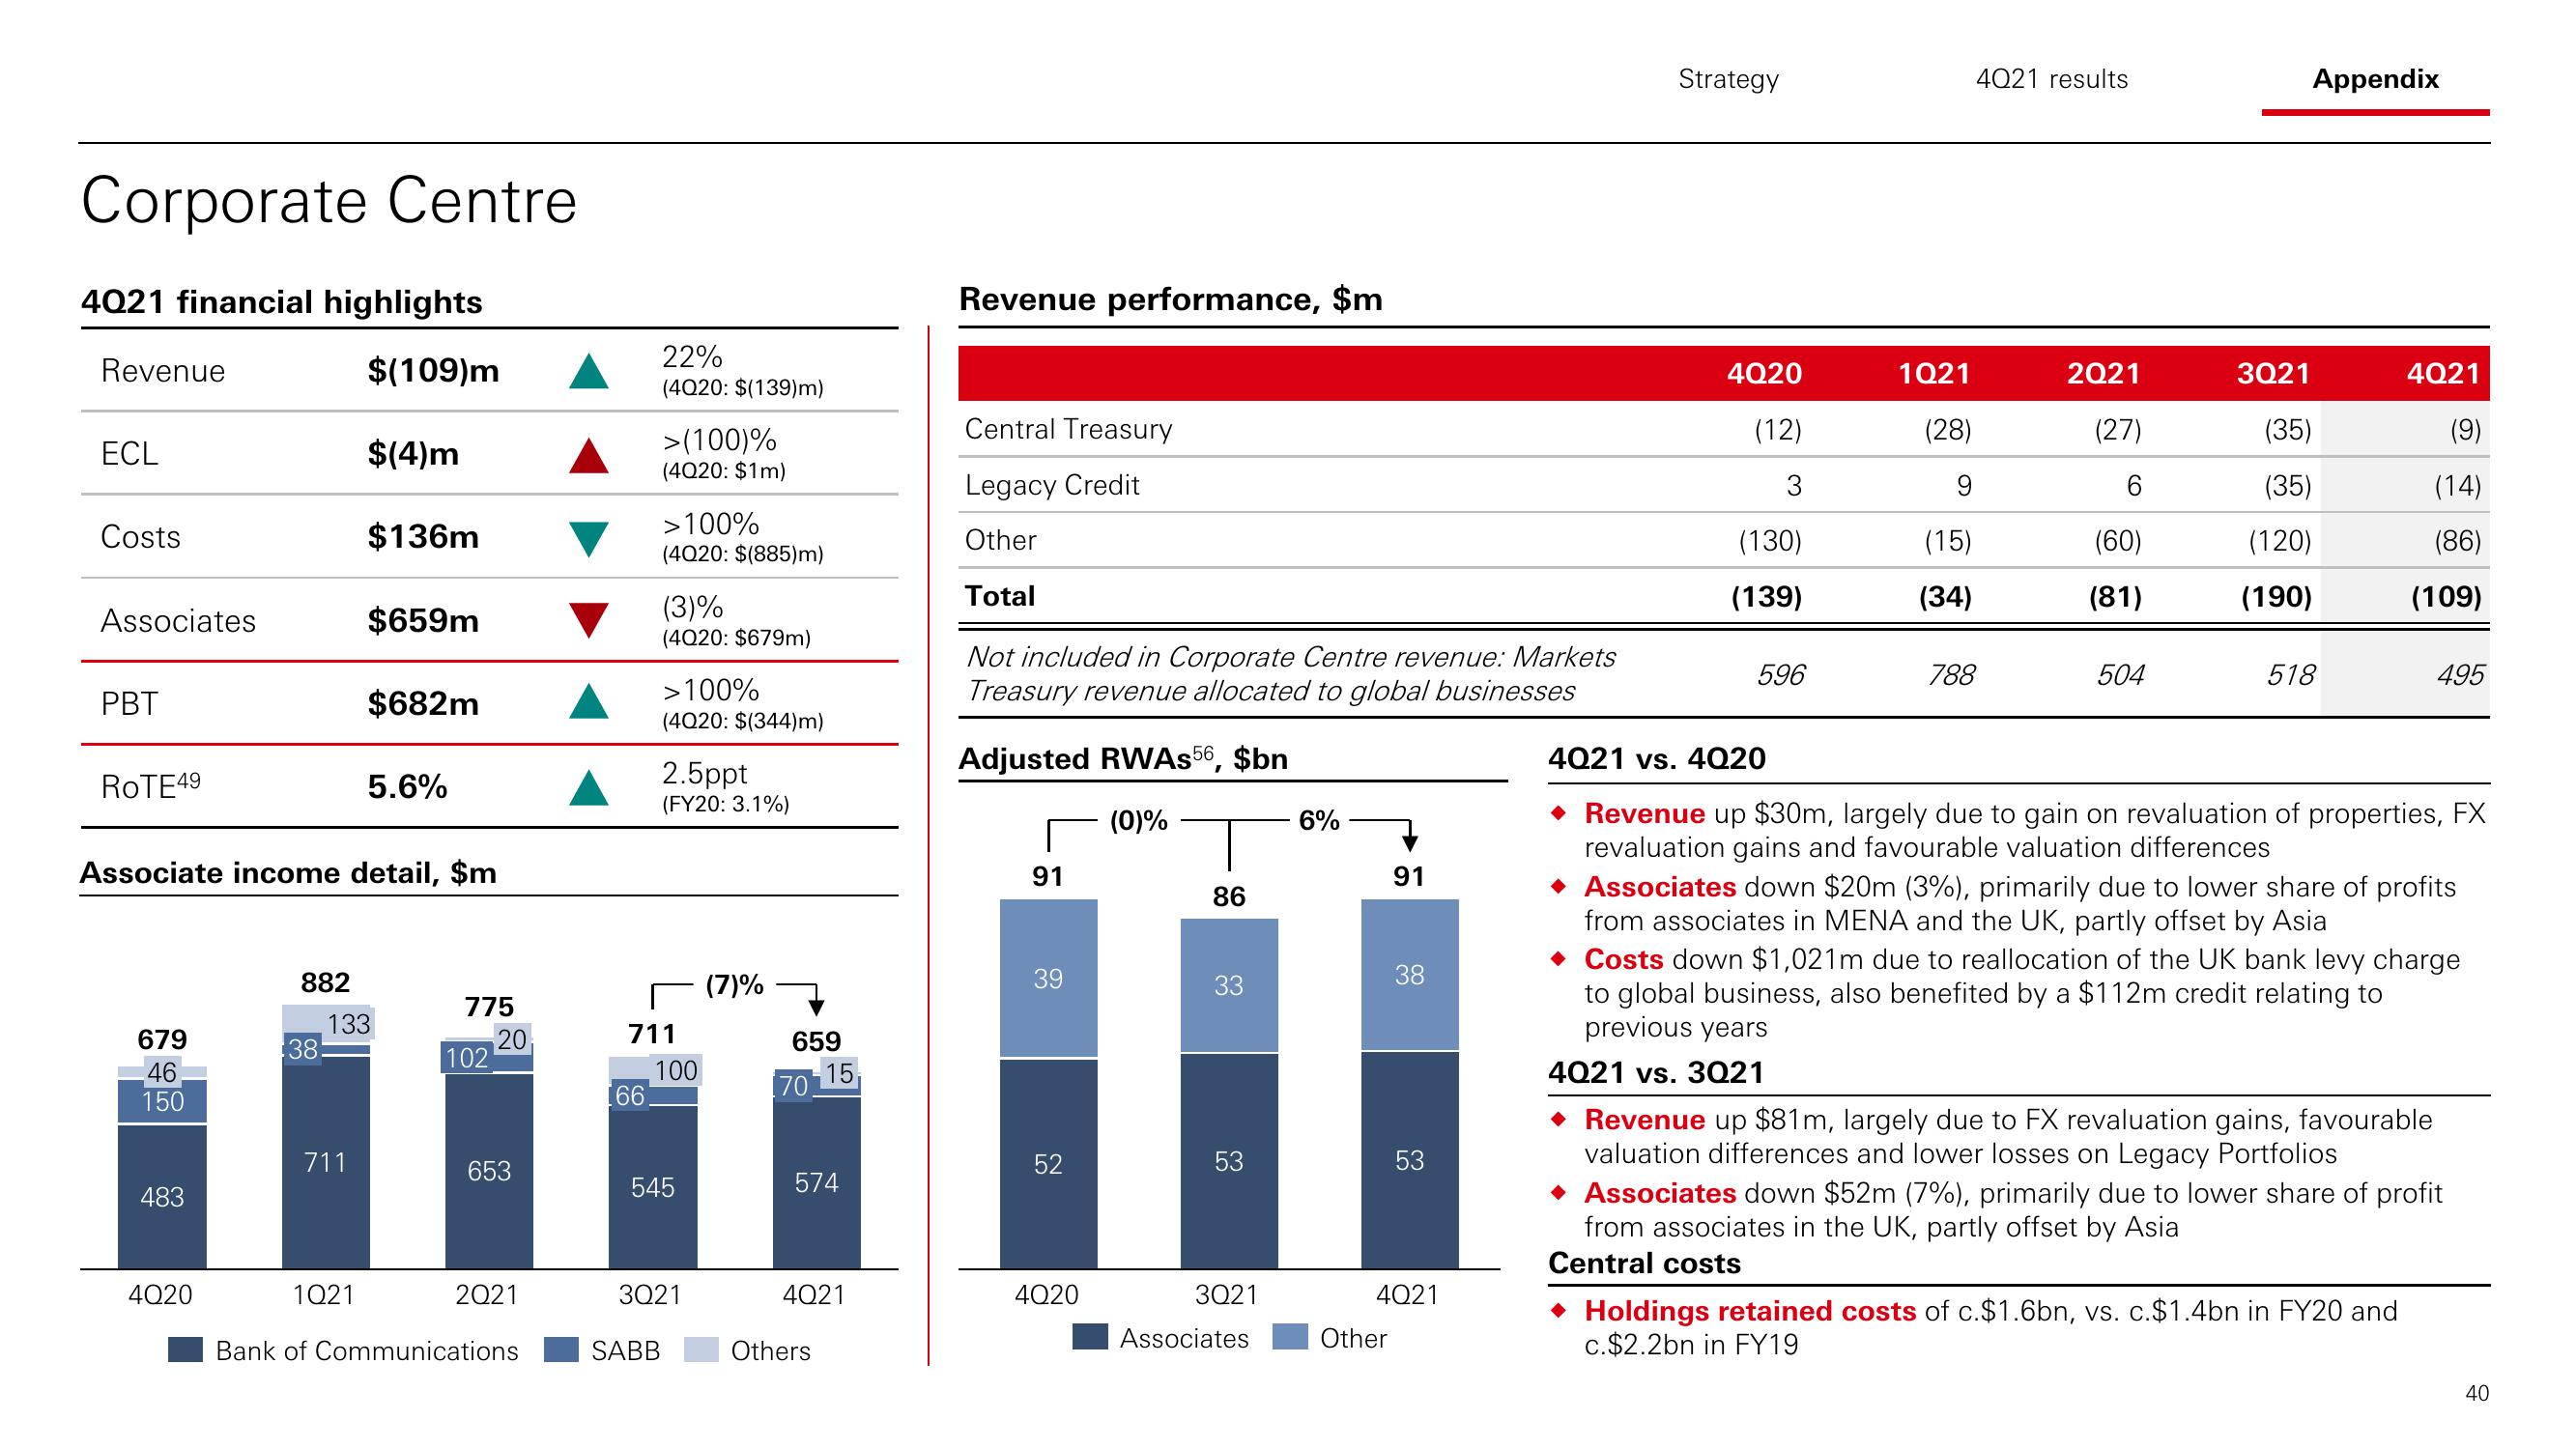
◆ Revenue up $30m, largely due to gain on revaluation of properties, FX
revaluation gains and favourable valuation differences
495
◆ Associates down $20m (3%), primarily due to lower share of profits
from associates in MENA and the UK, partly offset by Asia
Costs down $1,021m due to reallocation of the UK bank levy charge
to global business, also benefited by a $112m credit relating to
previous years
4021 vs. 3021
◆ Revenue up $81m, largely due to FX revaluation gains, favourable
valuation differences and lower losses on Legacy Portfolios
Holdings retained costs of c.$1.6bn, vs. c.$1.4bn in FY20 and
c.$2.2bn in FY19
◆ Associates down $52m (7%), primarily due to lower share of profit
from associates in the UK, partly offset by Asia
Central costs
40View entire presentation