Antero Midstream Partners Investor Presentation Deck
Attractive Valuation on Traditional Metrics
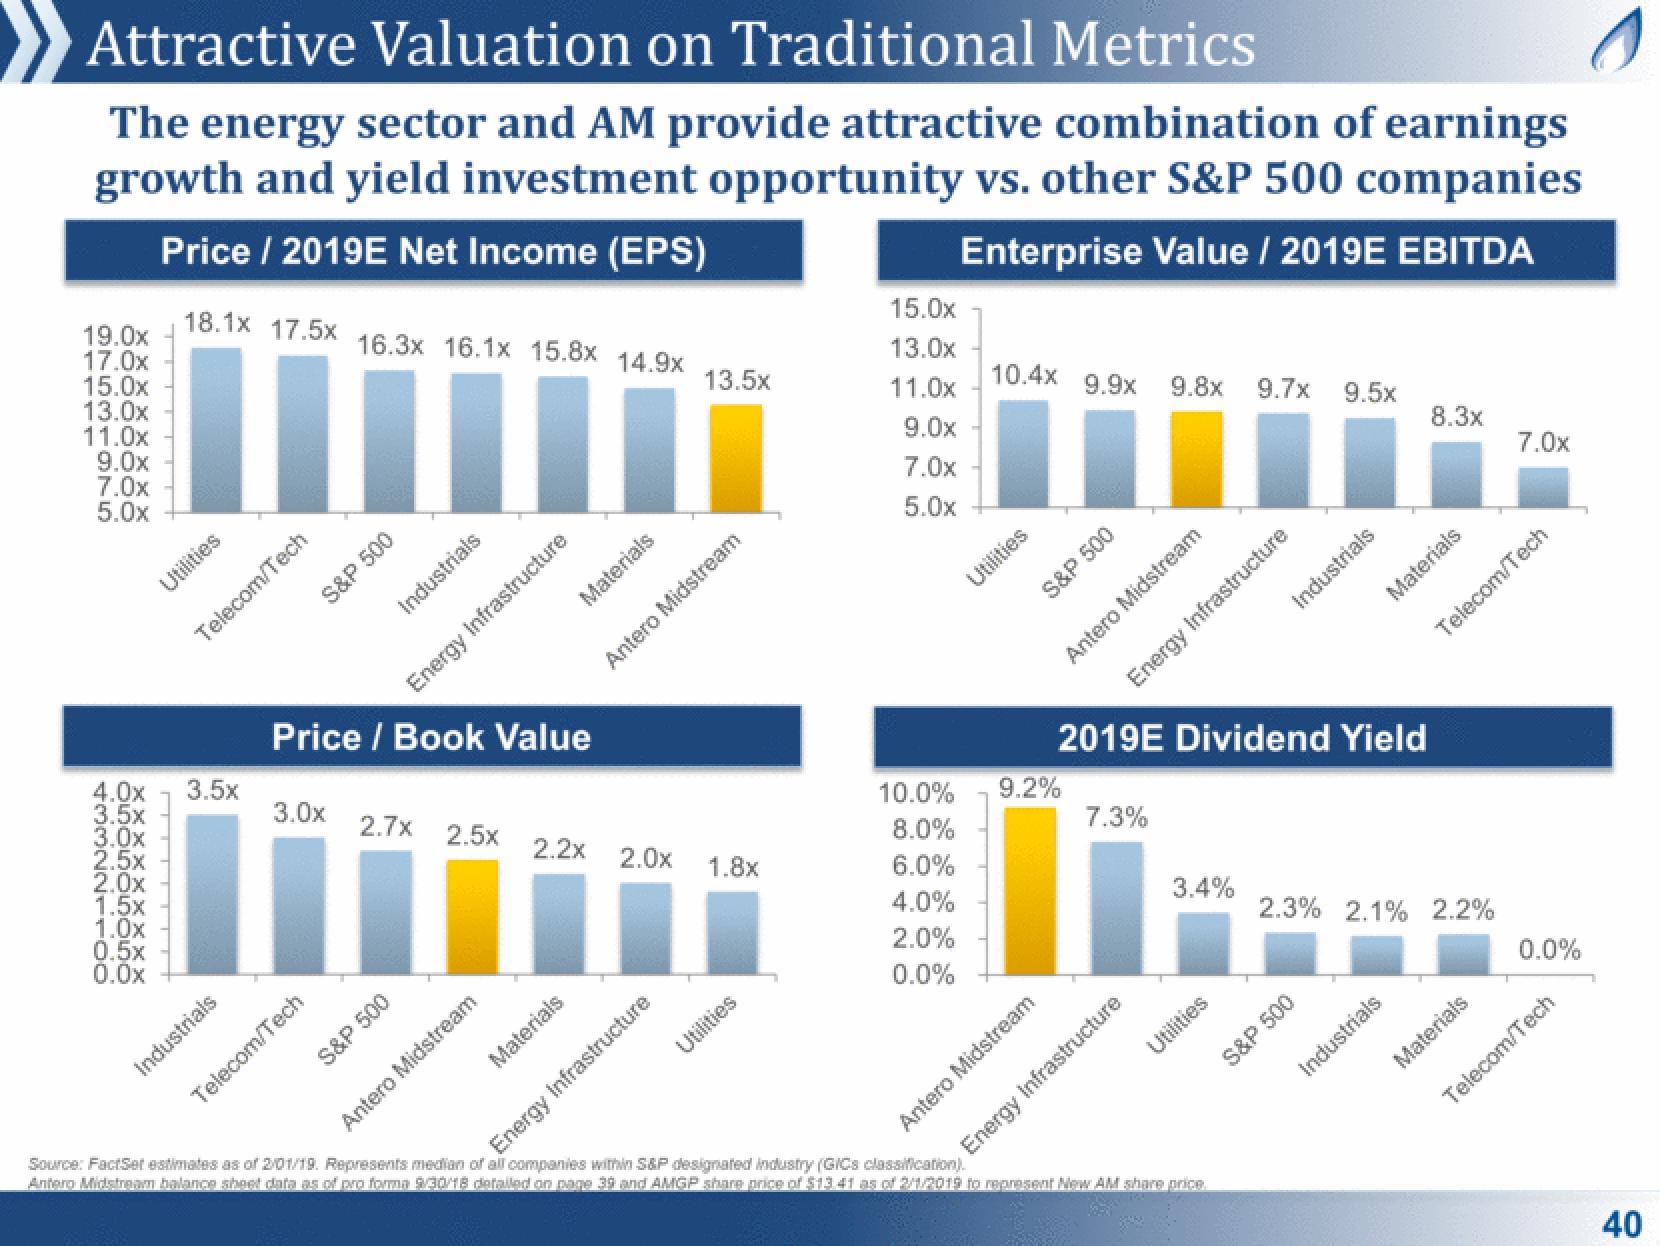
The energy sector and AM provide attractive combination of earnings
growth and yield investment opportunity vs. other S&P 500 companies
Price / 2019E Net Income (EPS)
Enterprise Value / 2019E EBITDA
18.1x 17.5x
19.0x
17.0x
15.0x
13.0x
11.0x
9.0x
7.0x
5.0x
Utilities
1.5x
1.0x
0.5x
0.0x
Telecom/Tech
4.0x 3.5x
3.5x -
3.0x -
2.5x
2.0x-
Industrials
3.0x
16.3x 16.1x 15.8x 14.9x
S&P 500
Telecom/Tech
Industrials
Price / Book Value
S&P 500
2.7x 2.5x
Energy Infrastructure
Materials
Antero Midstream
2.2x
Materials
13.5x
Antero Midstream
2.0x 1.8x
Utilities
Energy Infrastructure
15.0x
13.0x
11.0x
9.0x
7.0x
5.0x
10.4x 9.9x
S&P 500
10.0% 9.2%
8.0%
6.0%
4.0%
2.0%
0.0%
Antero Midstream
Antero Midstream
9.8x 9.7x 9.5x
7.3%
2019E Dividend Yield
Energy Infrastructure
3.4%
Energy Infrastructure
Source: FactSet estimates as of 2/01/19. Represents median of all companies within S&P designated industry (GICs classification).
Antero Midstream balance sheet data as of pro forma 9/30/18 detailed on page 39 and AMGP share price of $13.41 as of 2/1/2019 to represent New AM share price.
Industrials
S&P 500
Materials
8.3x
2.3% 2.1% 2.2%
Industrials
Telecom/Tech
7.0x
Materials
0.0%
Telecom/Tech
40View entire presentation