Allego Results Presentation Deck
Demand Continued to Grow, and Visibility Remains High
Total Number of Charging Sessions
(in '000')
85
439
77%
2015-2021 CAGR: 104%
2018
1,035
79%
1,702
User Track Record on Allego's Network¹
(in % recurring users)
2019
2015 2016 2017 2018 2019 2020 2021 1Q2021 1Q2022
Allego>
2,969
82%
2020
3,701
6,120
80%
(1)
(2)
(3)
(4)
82%
||
2021
1,162
1Q2021
2,139
80%
1Q2022
Charging Sessions Increasing with High Recurring Users
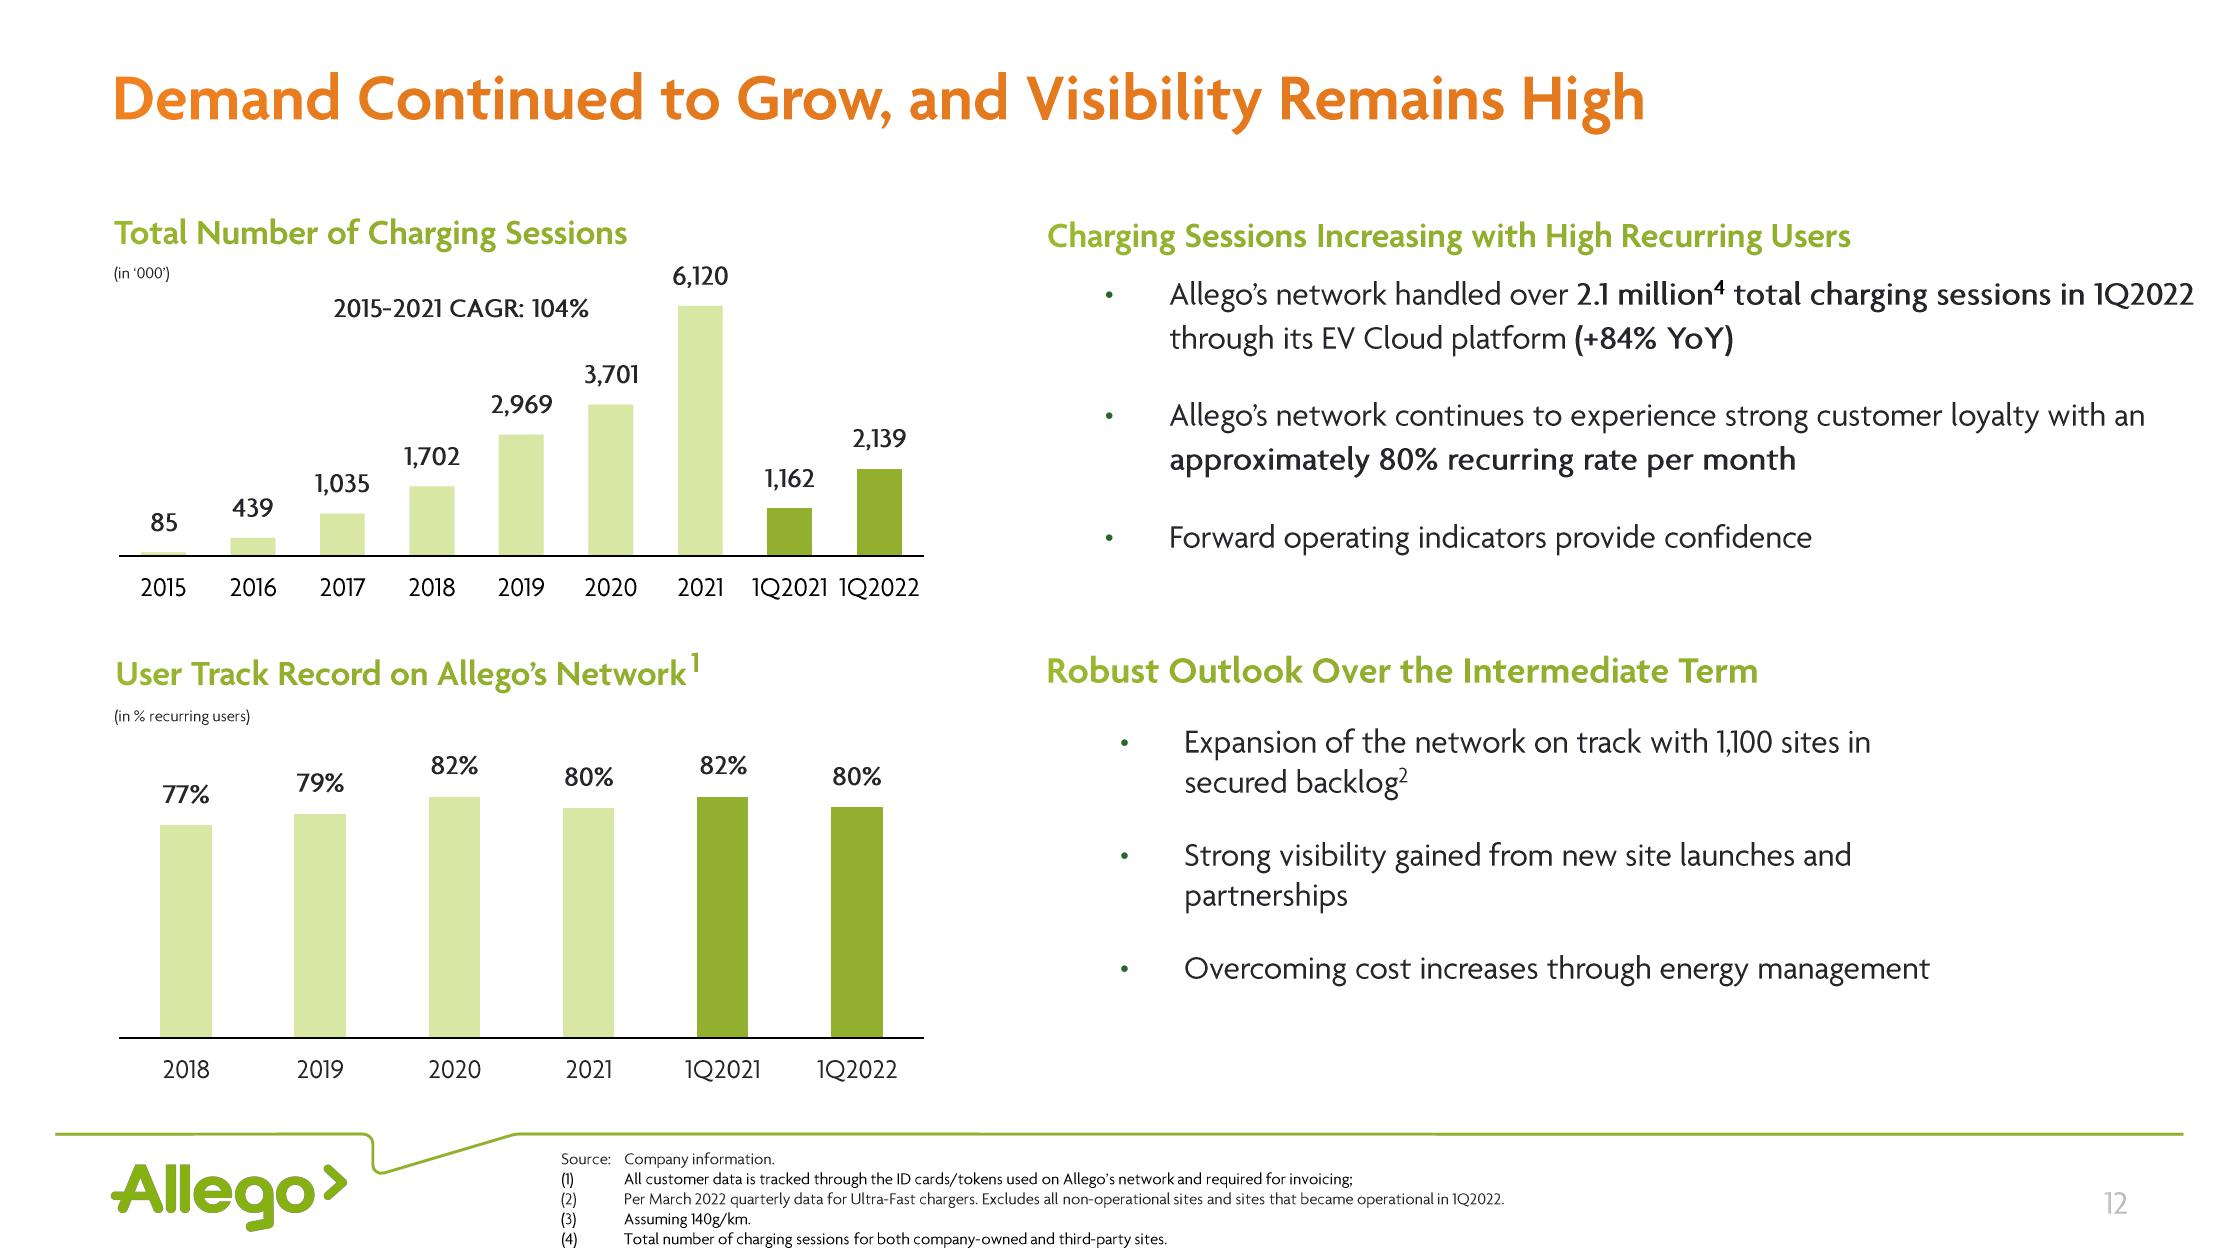
Allego's network handled over 2.1 million total charging sessions in 1Q2022
through its EV Cloud platform (+84% YoY)
●
Allego's network continues to experience strong customer loyalty with an
approximately 80% re ing rate per month
Forward operating indicators provide confidence
Robust Outlook Over the Intermediate Term
Expansion of the network on track with 1,100 sites in
secured backlog²
Strong visibility gained from new site launches and
partnerships
Overcoming cost increases through energy management
Source: Company information.
All customer data is tracked through the ID cards/tokens used on Allego's network and required for invoicing;
Per March 2022 quarterly data for Ultra-Fast chargers. Excludes all non-operational sites and sites that became operational in 1Q2022.
Assuming 140g/km.
Total number of charging sessions for both company-owned and third-party sites.
12View entire presentation