PJT Partners Investment Banking Pitch Book
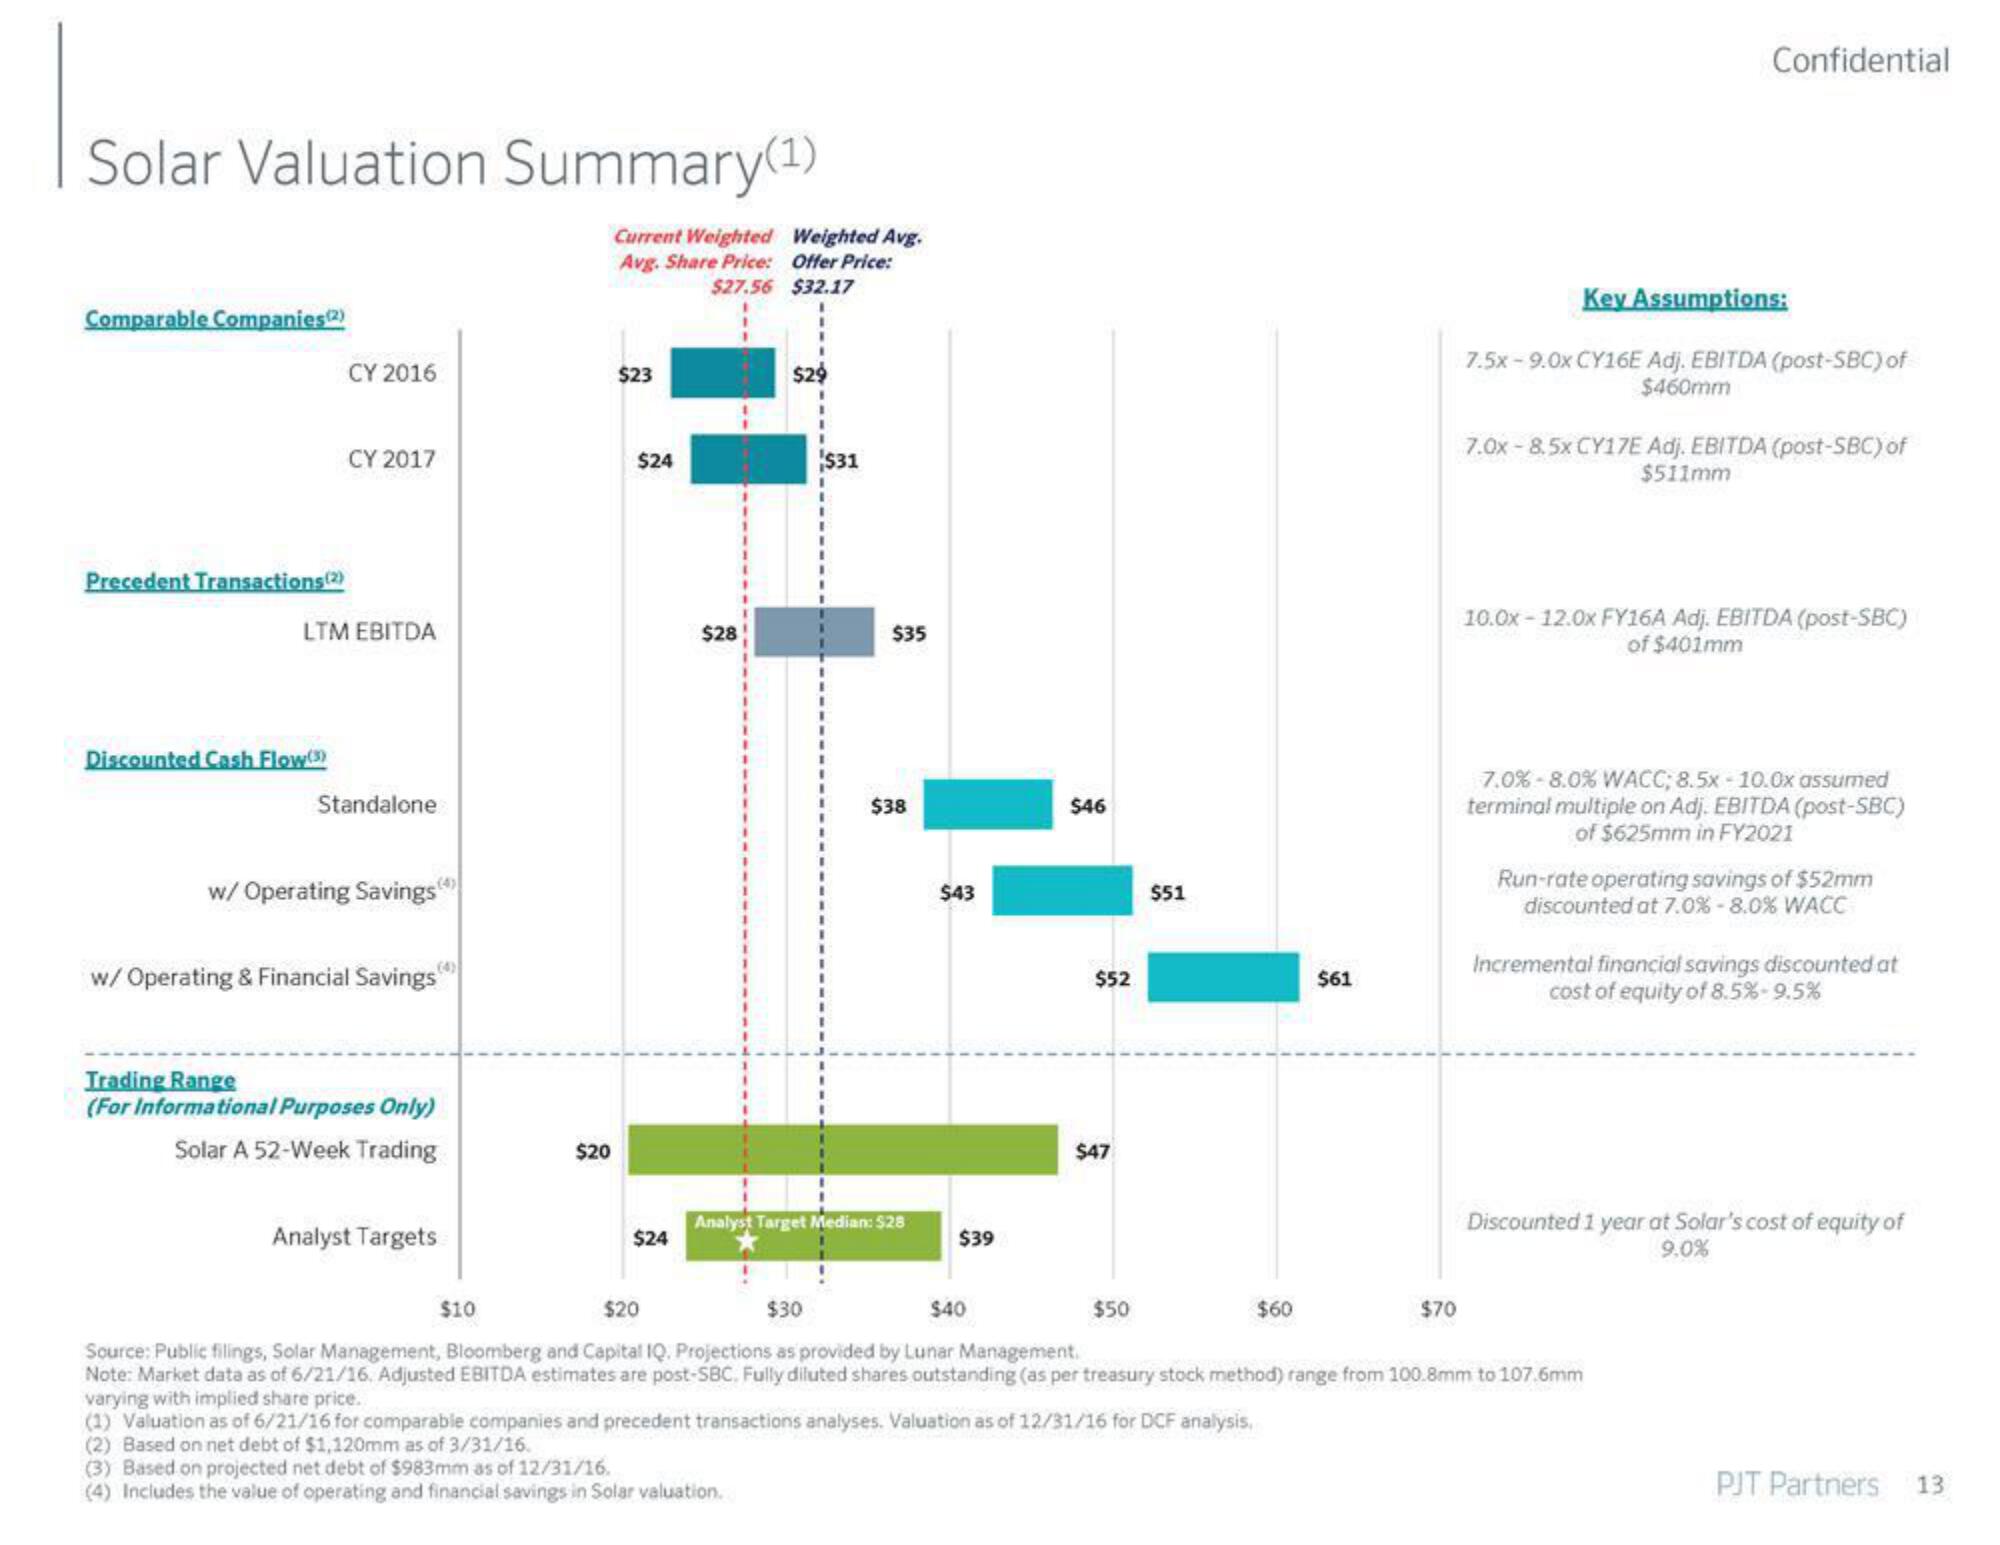
Solar Valuation Summary(¹)
Comparable Companies(2)
Precedent Transactions (2)
CY 2016
Discounted Cash Flow(3)
CY 2017
LTM EBITDA
Standalone
w/ Operating Savings
w/ Operating & Financial Savings
Trading Range
(For Informational Purposes Only)
Solar A 52-Week Trading
Analyst Targets
$20
Current Weighted Weighted Avg.
Avg. Share Price: Offer Price:
$27.56 $32.17
$23
$24
$24
$28
$29
$31
$35
$38
Analyst Target Median: $28
$43
$39
$46
$52
$47
$51
$50
$61
$60
$70
Confidential
Key Assumptions:
7.5x-9.0x CY16E Adj. EBITDA (post-SBC) of
$460mm
7.0x-8.5x CY17E Adj. EBITDA (post-SBC) of
$511mm
10.0x-12.0x FY16A Adj. EBITDA (post-SBC)
of $401mm
7.0% -8.0% WACC; 8.5x - 10.0x assumed
terminal multiple on Adj. EBITDA (post-SBC)
of $625mm in FY2021
$10
$20
$30
$40
Source: Public filings, Solar Management, Bloomberg and Capital IQ. Projections as provided by Lunar Management.
Note: Market data as of 6/21/16. Adjusted EBITDA estimates are post-SBC. Fully diluted shares outstanding (as per treasury stock method) range from 100.8mm to 107.6mm
varying with implied share price.
(1) Valuation as of 6/21/16 for comparable companies and precedent transactions analyses. Valuation as of 12/31/16 for DCF analysis,
(2) Based on net debt of $1,120mm as of 3/31/16.
(3) Based on projected net debt of $983mm as of 12/31/16.
(4) Includes the value of operating and financial savings in Solar valuation.
Run-rate operating savings of $52mm
discounted at 7.0% -8.0% WACC
Incremental financial savings discounted at
cost of equity of 8.5%-9.5%
Discounted 1 year at Solar's cost of equity of
9.0%
PJT Partners
13View entire presentation