LSE Results Presentation Deck
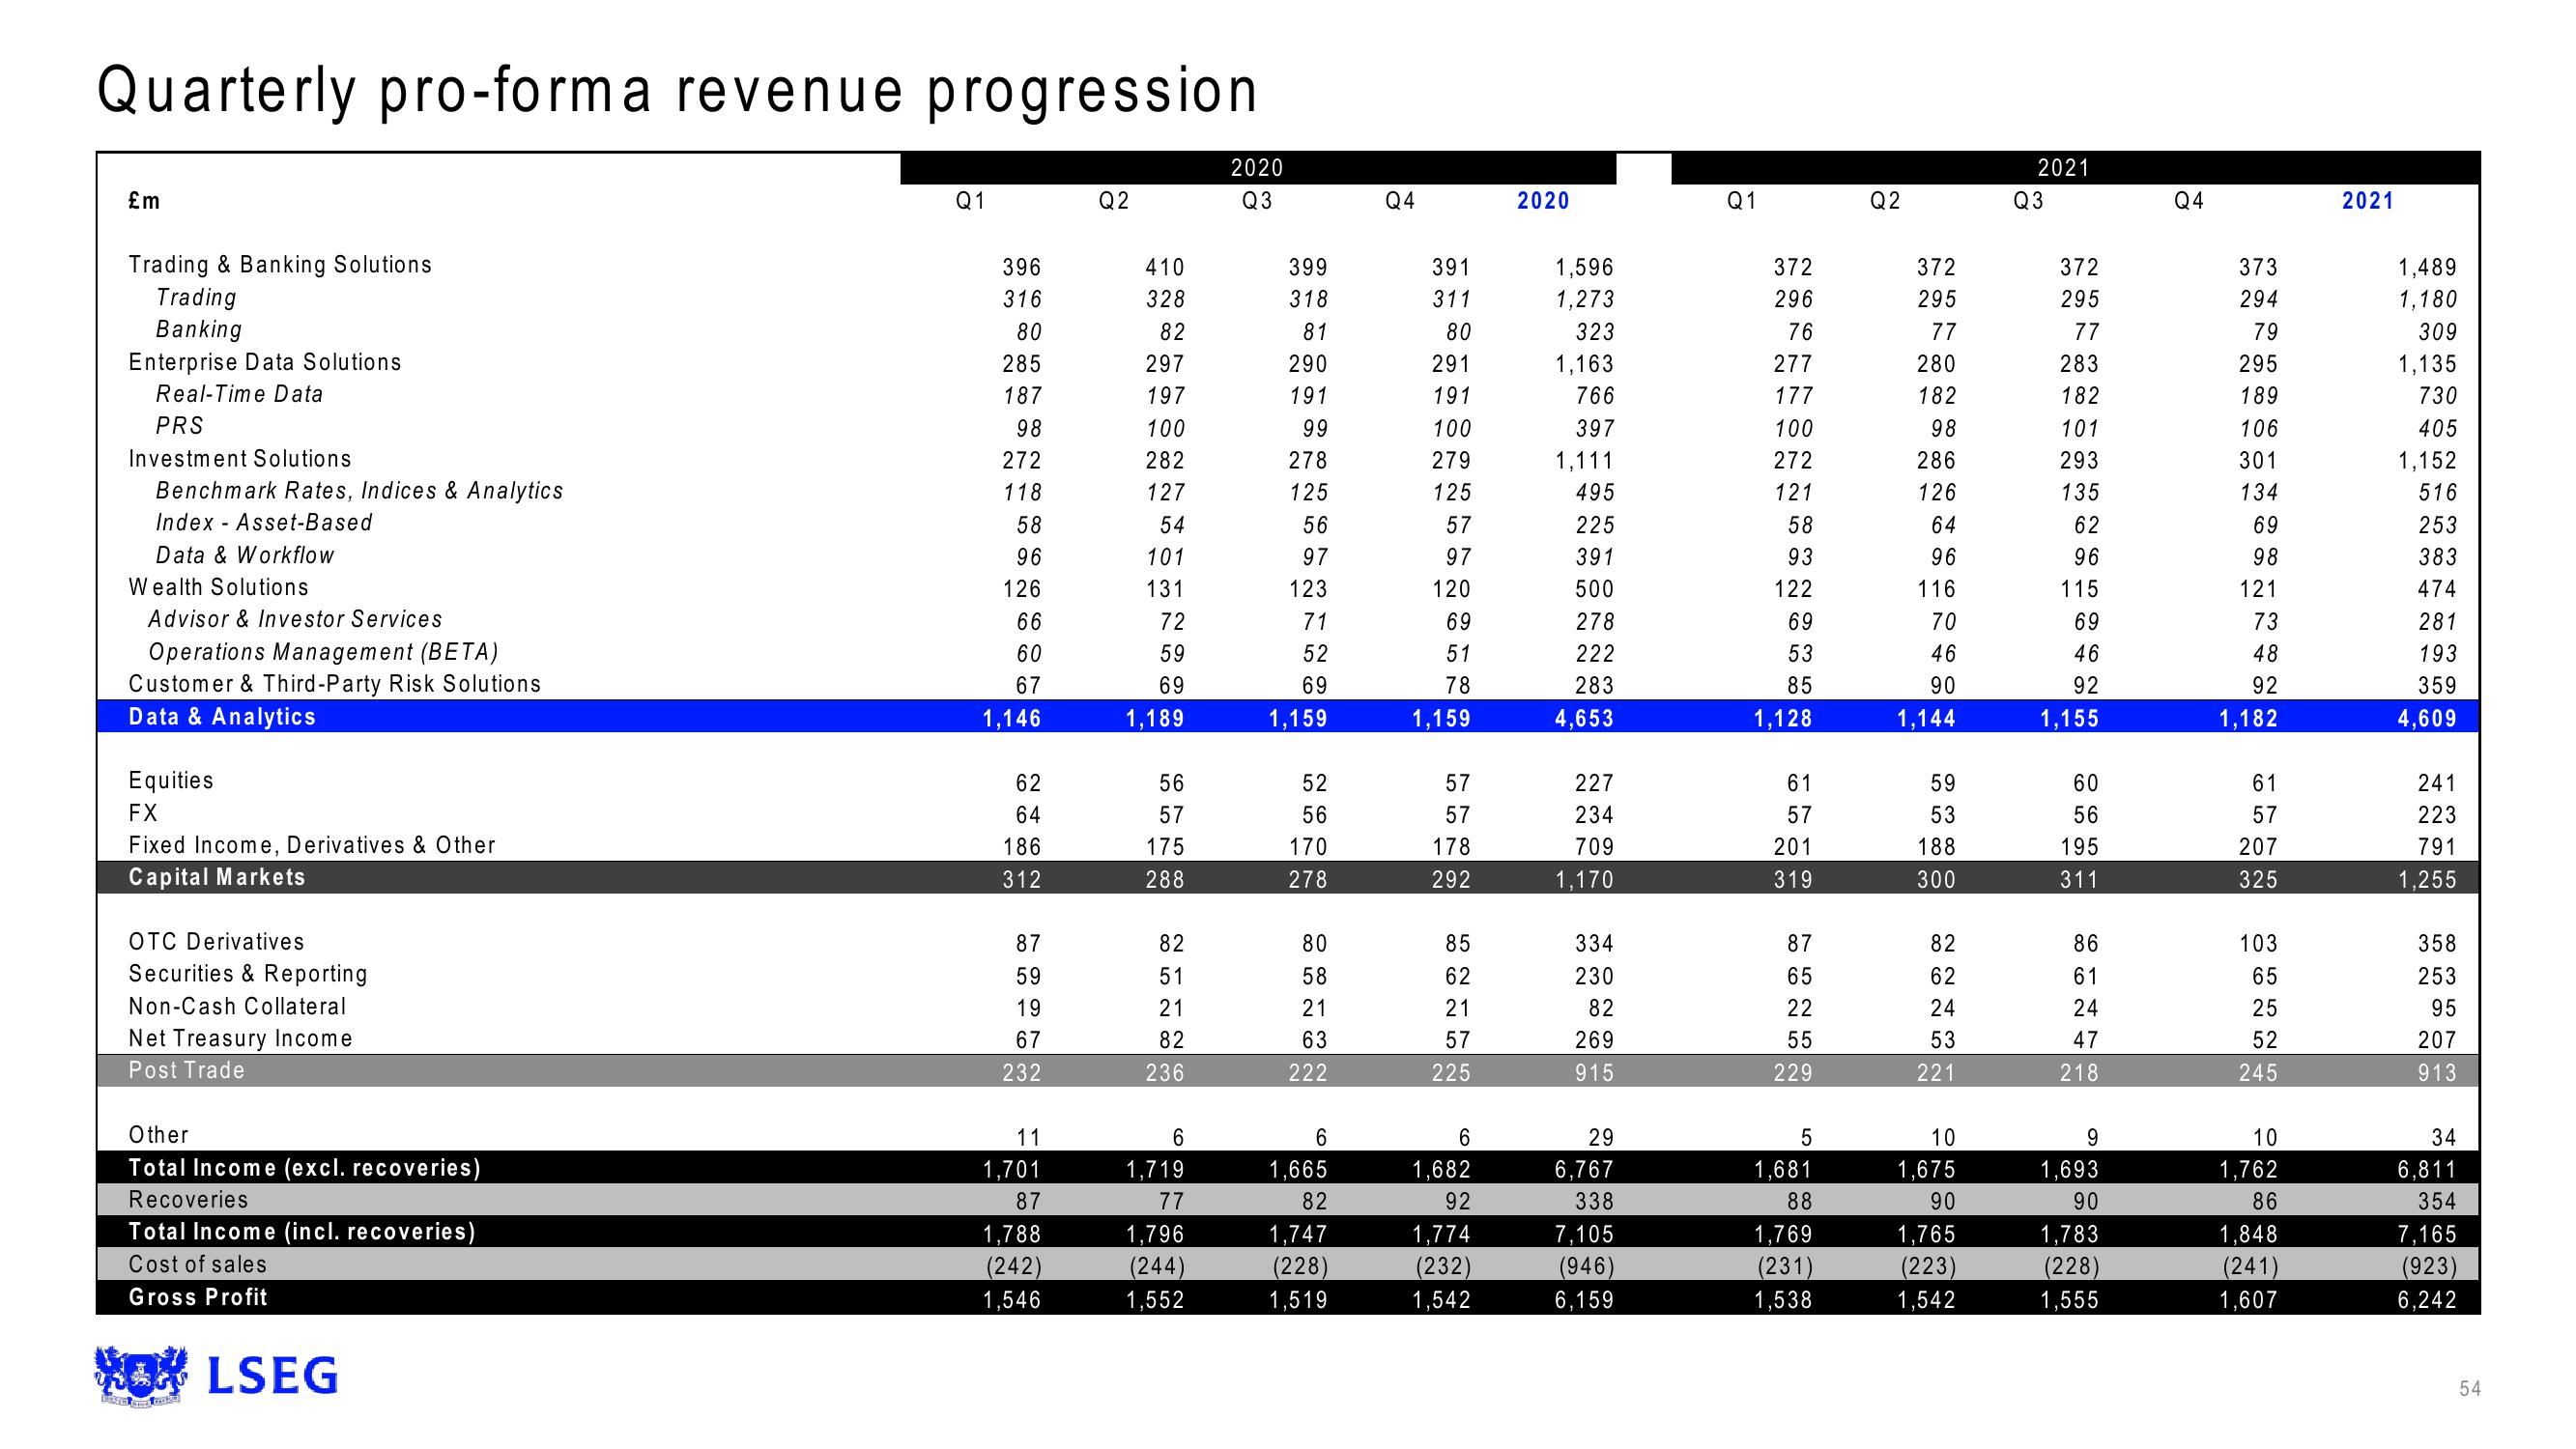
Quarterly pro-forma revenue progression.
£m
Trading & Banking Solutions
Trading
Banking
Enterprise Data Solutions
Real-Time Data
PRS
Investment Solutions
Benchmark Rates, Indices & Analytics
Index Asset-Based
Data & Workflow
Wealth Solutions
Advisor & Investor Services
Operations Management (BETA)
Customer & Third-Party Risk Solutions
Data & Analytics
Equities
FX
Fixed Income, Derivatives & Other
Capital Markets
OTC Derivatives
Securities & Reporting
Non-Cash Collateral
Net Treasury Income
Post Trade
Other
Total Income (excl. recoveries)
Recoveries
Total Income (incl. recoveries)
Cost of sales
Gross Profit
WOLSEG
Q1
396
316
80
285
187
98
272
118
58
96
126
66
60
67
1,146
62
64
186
312
87
59
19
67
232
11
1,701
87
1,788
(242)
1,546
Q2
410
328
82
297
197
100
282
127
54
101
131
72
59
69
1,189
56
57
175
288
82
51
21
82
236
6
1,719
77
1,796
(244)
1,552
2020
Q3
399
318
81
290
191
99
278
125
56
97
123
71
52
69
1,159
52
56
170
278
80
58
21
63
222
6
1,665
82
1,747
(228)
1,519
Q4
391
311
80
291
191
100
279
125
57
97
120
69
51
78
1,159
57
57
178
292
85
62
21
57
225
6
1,682
92
1,774
(232)
1,542
2020
1,596
1,273
323
1,163
766
397
1,111
495
225
391
500
278
222
283
4,653
227
234
709
1,170
334
230
82
269
915
29
6,767
338
7,105
(946)
6,159
Q1
372
296
76
277
177
100
272
121
58
93
122
69
53
85
1,128
669
CO LO
61
57
201
319
ܗ ܗ
87
65
22
55
229
5
1,681
88
1,769
(231)
1,538
Q2
372
295
77
280
182
98
286
126
64
96
116
70
46
90
1,144
59
53
188
300
82
62
24
53
221
10
1,675
90
1,765
(223)
1,542
2021
Q3
372
295
77
283
182
101
293
135
62
96
115
69
46
92
1,155
60
56
195
311
86
61
24
47
218
9
1,693
90
1,783
(228)
1,555
Q4
373
294
79
295
189
106
301
134
69
98
121
73
48
92
1,182
61
57
207
325
103
65
25
52
245
10
1,762
86
1,848
(241)
1,607
2021
1,489
1,180
309
1,135
730
405
1,152
516
253
383
474
281
193
359
4,609
241
223
791
1,255
358
253
95
207
913
34
6,811
354
7,165
(923)
6,242
54View entire presentation