Maersk Results Presentation Deck
Maersk Group
- Interim Report 03 2015
MAERSK GROUP
PERFORMANCE
For Q3 2015
Contents
The Maersk Group- and especially Maersk Line - was severely
impacted by continued low economic growth and significant
market imbalances. Global container demand is expected to
have grown by 0-1%, whereas the global container fleet grew by
almost 9%. Container freight rates declined significantly across
all trades except North America, and especially Maersk Line's
key Europe trades were impacted severely.
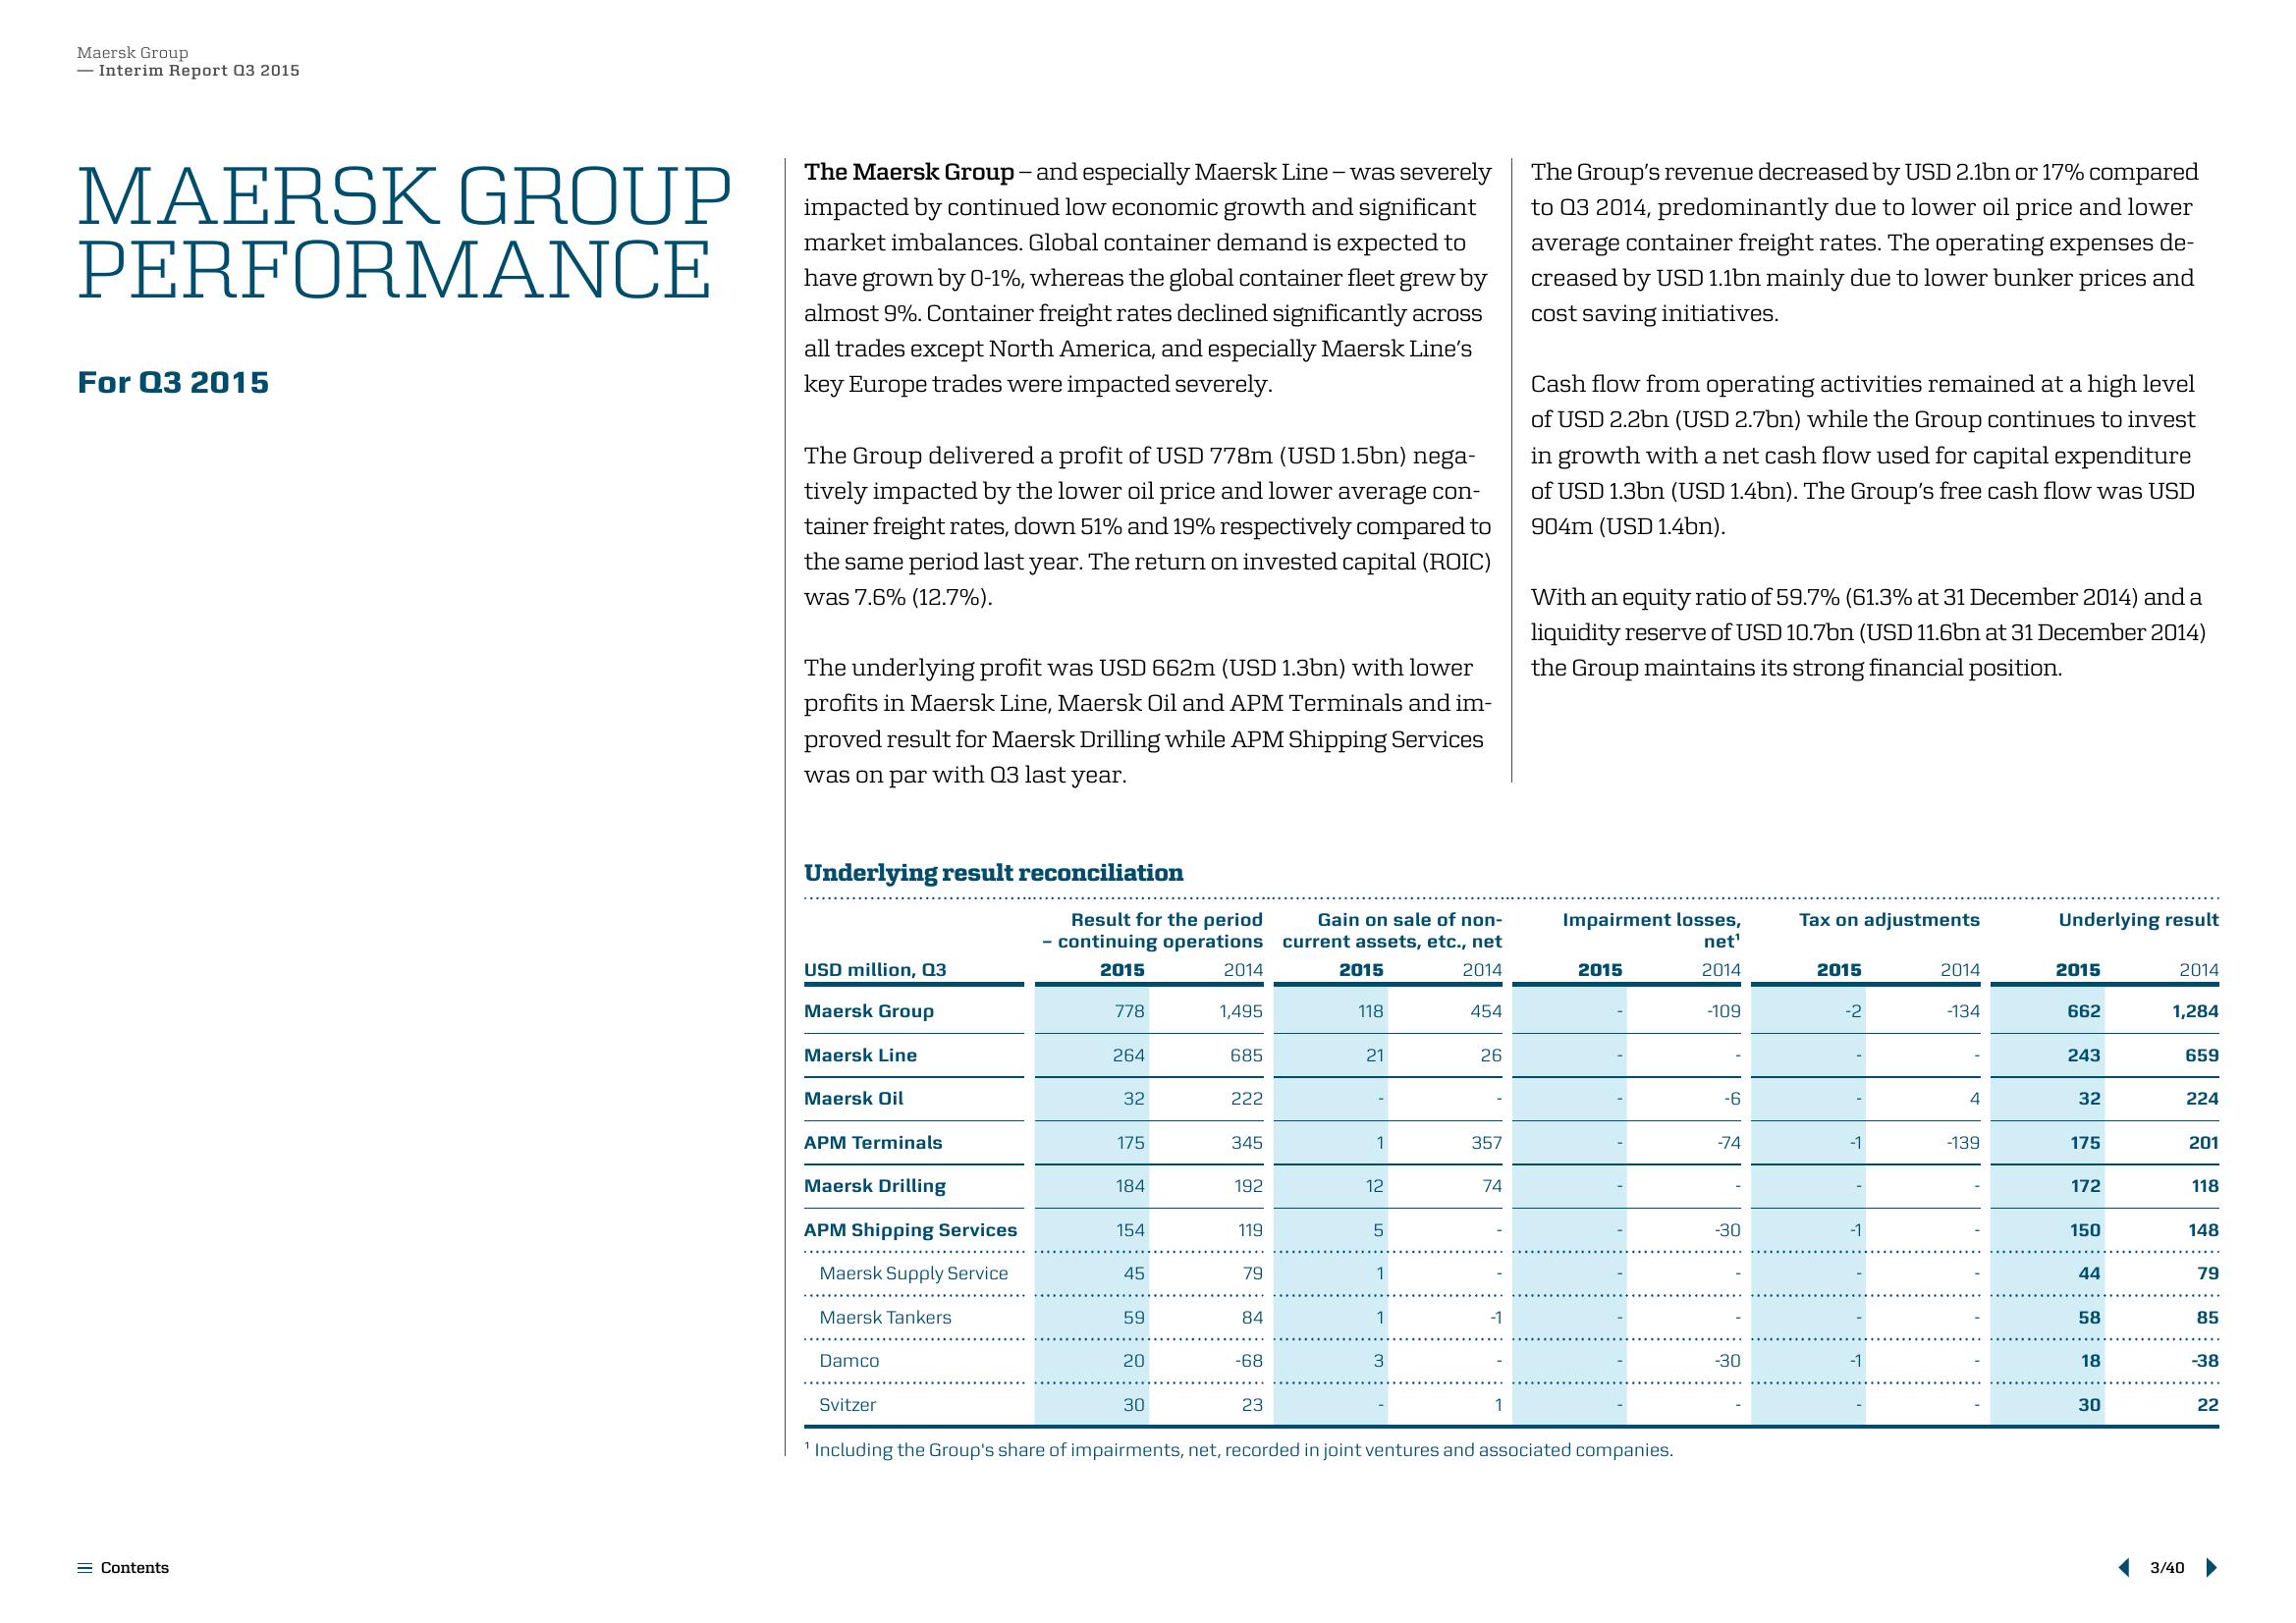
The Group delivered a profit of USD 778m (USD 1.5bn) nega-
tively impacted by the lower oil price and lower average con-
tainer freight rates, down 51% and 19% respectively compared to
the same period last year. The return on invested capital (ROIC)
was 7.6% (12.7%).
The underlying profit was USD 662m (USD 1.3bn) with lower
profits in Maersk Line, Maersk Oil and APM Terminals and im-
proved result for Maersk Drilling while APM Shipping Services
was on par with Q3 last year.
Underlying result reconciliation
USD million, Q3
Maersk Group
Maersk Line
Maersk Oil
APM Terminals
Maersk Drilling
APM Shipping Services
Maersk Supply Service
Maersk Tankers
Damco
Svitzer
Result for the period
- continuing operations
2015
778
264
32
175
184
154
45
59
20
30
2014
1,495
685
222
345
192
119
79
84
-68
23
Gain on sale of non-
current assets, etc., net
2014
2015
118
21
1
12
5
1
1
3
454
26
357
74
1
-1
1
The Group's revenue decreased by USD 2.1bn or 17% compared
to 03 2014, predominantly due to lower oil price and lower
average container freight rates. The operating expenses de-
creased by USD 1.1bn mainly due to lower bunker prices and
cost saving initiatives.
Cash flow from operating activities remained at a high level
of USD 2.2bn (USD 2.7bn) while the Group continues to invest
in growth with a net cash flow used for capital expenditure
of USD 1.3bn (USD 1.4bn). The Group's free cash flow was USD
904m (USD 1.4bn).
With an equity ratio of 59.7% (61.3% at 31 December 2014) and a
liquidity reserve of USD 10.7bn (USD 11.6bn at 31 December 2014)
the Group maintains its strong financial position.
Impairment losses,
net¹
2014
2015
'Including the Group's share of impairments, net, recorded in joint ventures and associated companies.
-109
-6
-74
-30
-30
Tax on adjustments
2015
-2
-1
-1
-1
2014
-134
4
-139
Underlying result
2015
662
243
32
175
172
150
44
58
18
30
2014
1,284
3/40
659
224
201
118
148
79
85
-38
22View entire presentation