Bridge Investment Group Results Presentation Deck
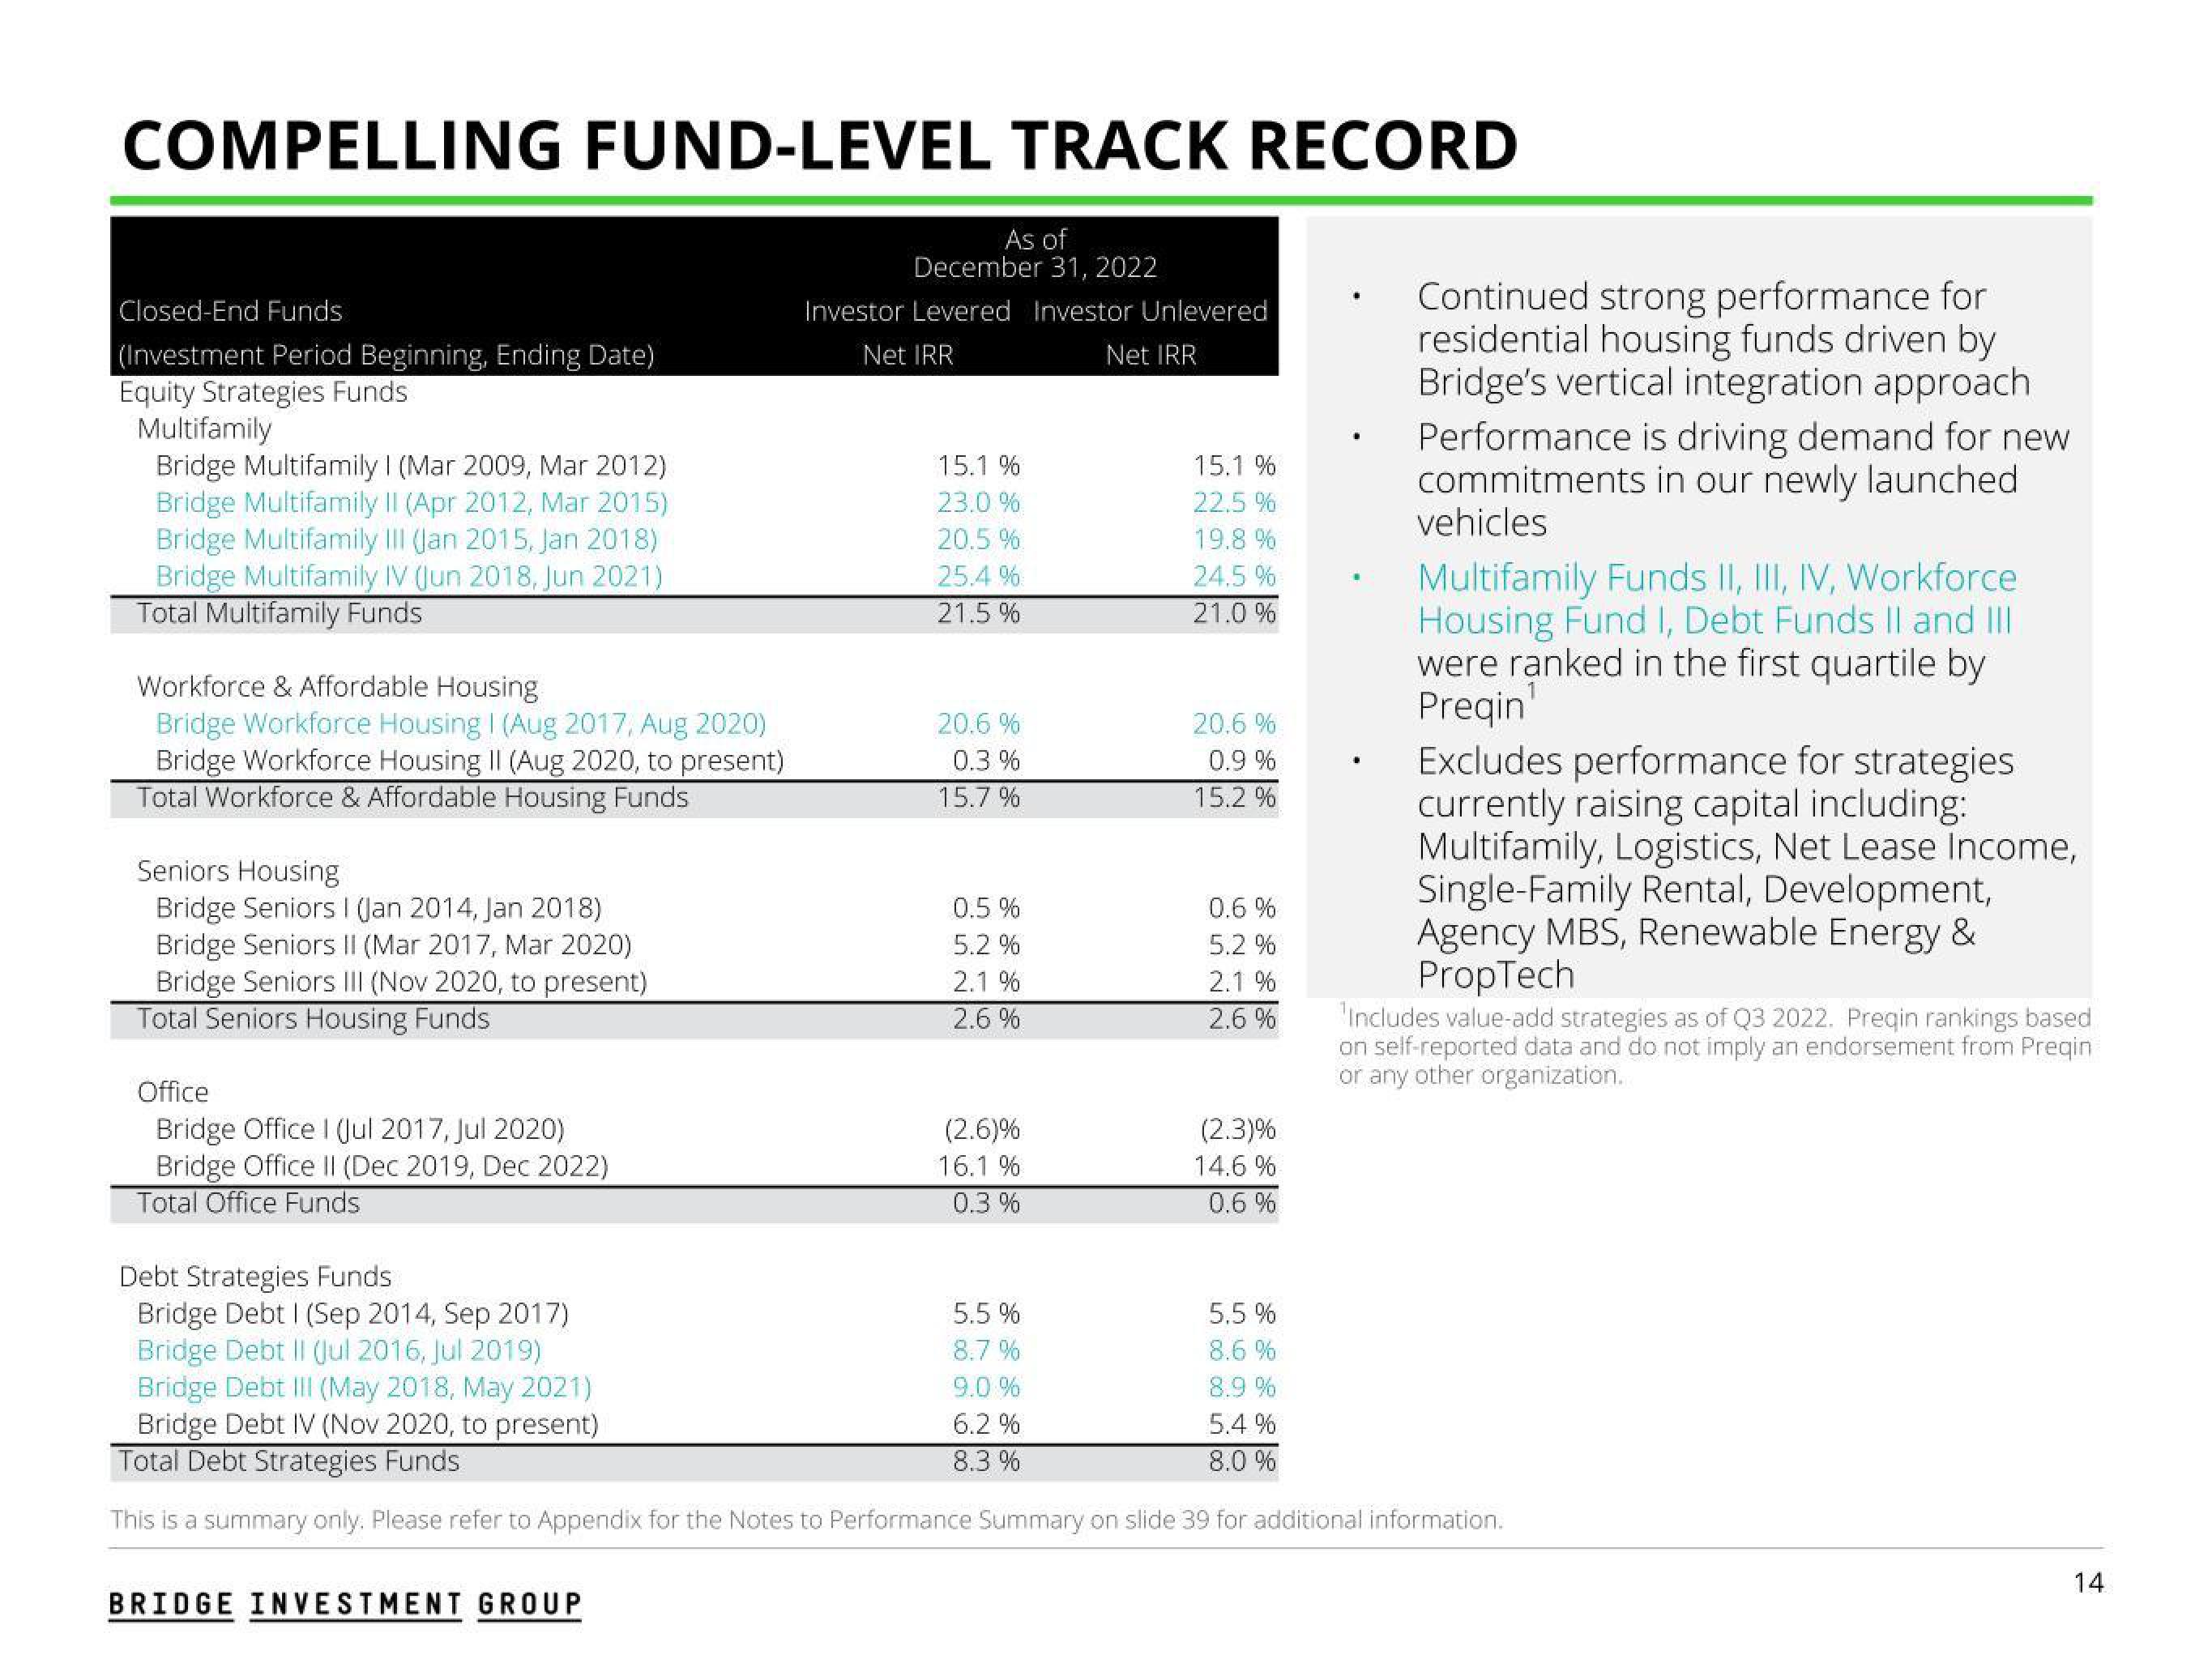
COMPELLING FUND-LEVEL TRACK RECORD
As of
December 31, 2022
Investor Levered Investor Unlevered
Net IRR
Net IRR
Closed-End Funds
(Investment Period Beginning, Ending Date)
Equity Strategies Funds
Multifamily
Bridge Multifamily I (Mar 2009, Mar 2012)
Bridge Multifamily II (Apr 2012, Mar 2015)
Bridge Multifamily III (Jan 2015, Jan 2018)
Bridge Multifamily IV (Jun 2018, Jun 2021)
Total Multifamily Funds
Workforce & Affordable Housing
Bridge Workforce Housing I (Aug 2017, Aug 2020)
Bridge Workforce Housing II (Aug 2020, to present)
Total Workforce & Affordable Housing Funds
Seniors Housing
Bridge Seniors I (Jan 2014, Jan 2018)
Bridge Seniors II (Mar 2017, Mar 2020)
Bridge Seniors III (Nov 2020, to present)
Total Seniors Housing Funds
Office
Bridge Office I (Jul 2017, Jul 2020)
Bridge Office II (Dec 2019, Dec 2022)
Total Office Funds
15.1 %
23.0 %
20.5%
25.4 %
21.5%
BRIDGE INVESTMENT GROUP
20.6 %
0.3%
15.7%
0.5%
5.2 %
2.1 %
2.6%
(2.6)%
16.1%
0.3%
5.5%
8.7%
15.1 %
22.5 %
19.8 %
24.5 %
21.0%
9.0 %
6.2 %
8.3 %
20.6%
0.9 %
15.2 %
0.6 %
5.2 %
2.1%
2.6%
(2.3)%
14.6%
0.6 %
Debt Strategies Funds
Bridge Debt I (Sep 2014, Sep 2017)
Bridge Debt II (Jul 2016, Jul 2019)
Bridge Debt III (May 2018, May 2021)
Bridge Debt IV (Nov 2020, to present)
Total Debt Strategies Funds
This is a summary only. Please refer to Appendix for the Notes to Performance Summary on slide 39 for additional information.
Continued strong performance for
residential housing funds driven by
Bridge's vertical integration approach
Performance is driving demand for new
commitments in our newly launched
vehicles
5.5%
8.6 %
8.9 %
5.4 %
8.0 %
Multifamily Funds II, III, IV, Workforce
Housing Fund I, Debt Funds II and III
were ranked in the first quartile by
Preqin'
1
Excludes performance for strategies
currently raising capital including:
Multifamily, Logistics, Net Lease Income,
Single-Family Rental, Development,
Agency MBS, Renewable Energy &
PropTech
Includes value-add strategies as of Q3 2022. Preqin rankings based
on self-reported data and do not imply an endorsement from Preqin
or any other organization.
14View entire presentation