Comcast Results Presentation Deck
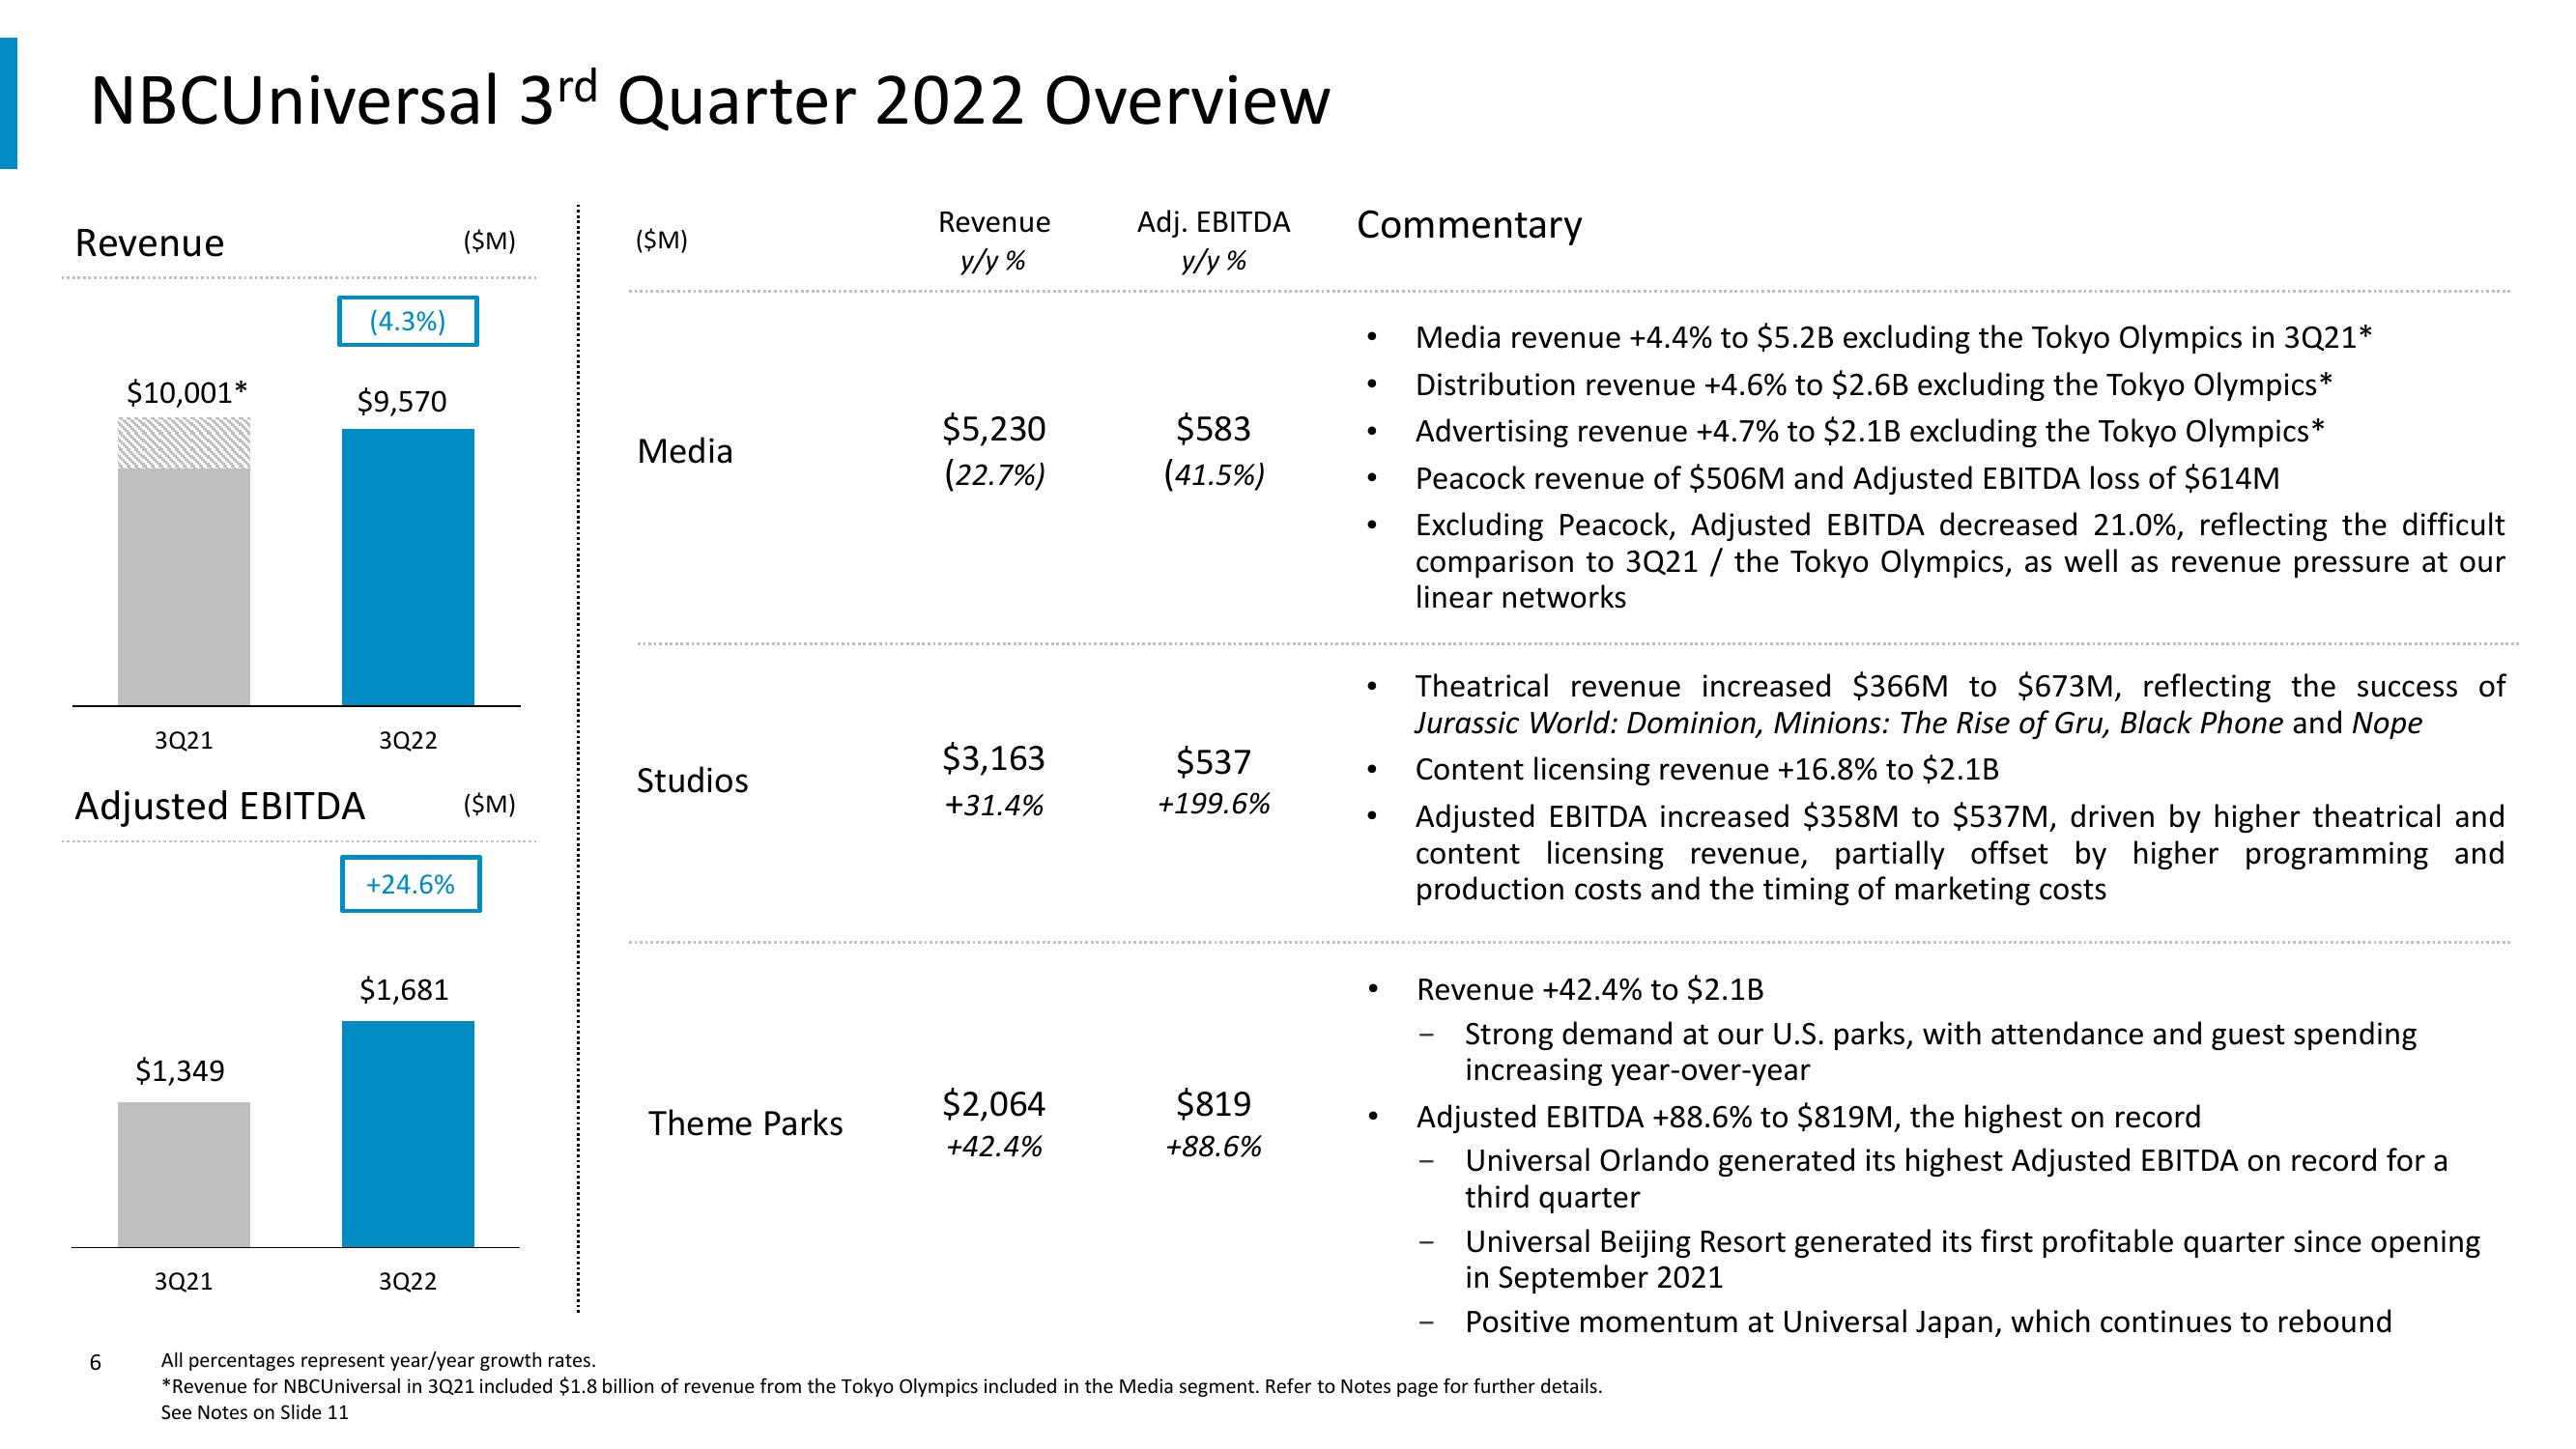
NBCUniversal 3rd Quarter 2022 Overview
Revenue
y/y%
Adj. EBITDA
y/y%
Revenue
$10,001*
6
3Q21
$1,349
(4.3%)
3Q21
$9,570
Adjusted EBITDA ($M)
3Q22
+24.6%
$1,681
($M)
3Q22
($M)
Media
Studios
Theme Parks
$5,230
(22.7%)
$3,163
+31.4%
$2,064
+42.4%
$583
(41.5%)
$537
+199.6%
$819
+88.6%
Commentary
●
●
●
●
Media revenue +4.4% to $5.2B excluding the Tokyo Olympics in 3Q21*
Distribution revenue +4.6% to $2.6B excluding the Tokyo Olympics*
Advertising revenue +4.7% to $2.1B excluding the Tokyo Olympics*
Peacock revenue of $506M and Adjusted EBITDA loss of $614M
Excluding Peacock, Adjusted EBITDA decreased 21.0%, reflecting the difficult
comparison to 3Q21 / the Tokyo Olympics, as well as revenue pressure at our
linear networks
Theatrical revenue increased $366M to $673M, reflecting the success of
Jurassic World: Dominion, Minions: The Rise of Gru, Black Phone and Nope
Content licensing revenue +16.8% to $2.1B
Adjusted EBITDA increased $358M to $537M, driven by higher theatrical and
content licensing revenue, partially offset by higher programming and
production costs and the timing of marketing costs
Revenue +42.4% to $2.1B
Strong demand at our U.S. parks, with attendance and guest spending
increasing year-over-year
Adjusted EBITDA +88.6% to $819M, the highest on record
Universal Orlando generated its highest Adjusted EBITDA on record for a
third quarter
Universal Beijing Resort generated its first profitable quarter since opening
in September 2021
Positive momentum at Universal Japan, which continues to rebound
All percentages represent year/year growth rates.
*Revenue for NBCUniversal in 3Q21 included $1.8 billion of revenue from the Tokyo Olympics included in the Media segment. Refer to Notes page for further details.
See Notes on Slide 11View entire presentation