Terran Orbital SPAC Presentation Deck
Operational Benchmarking
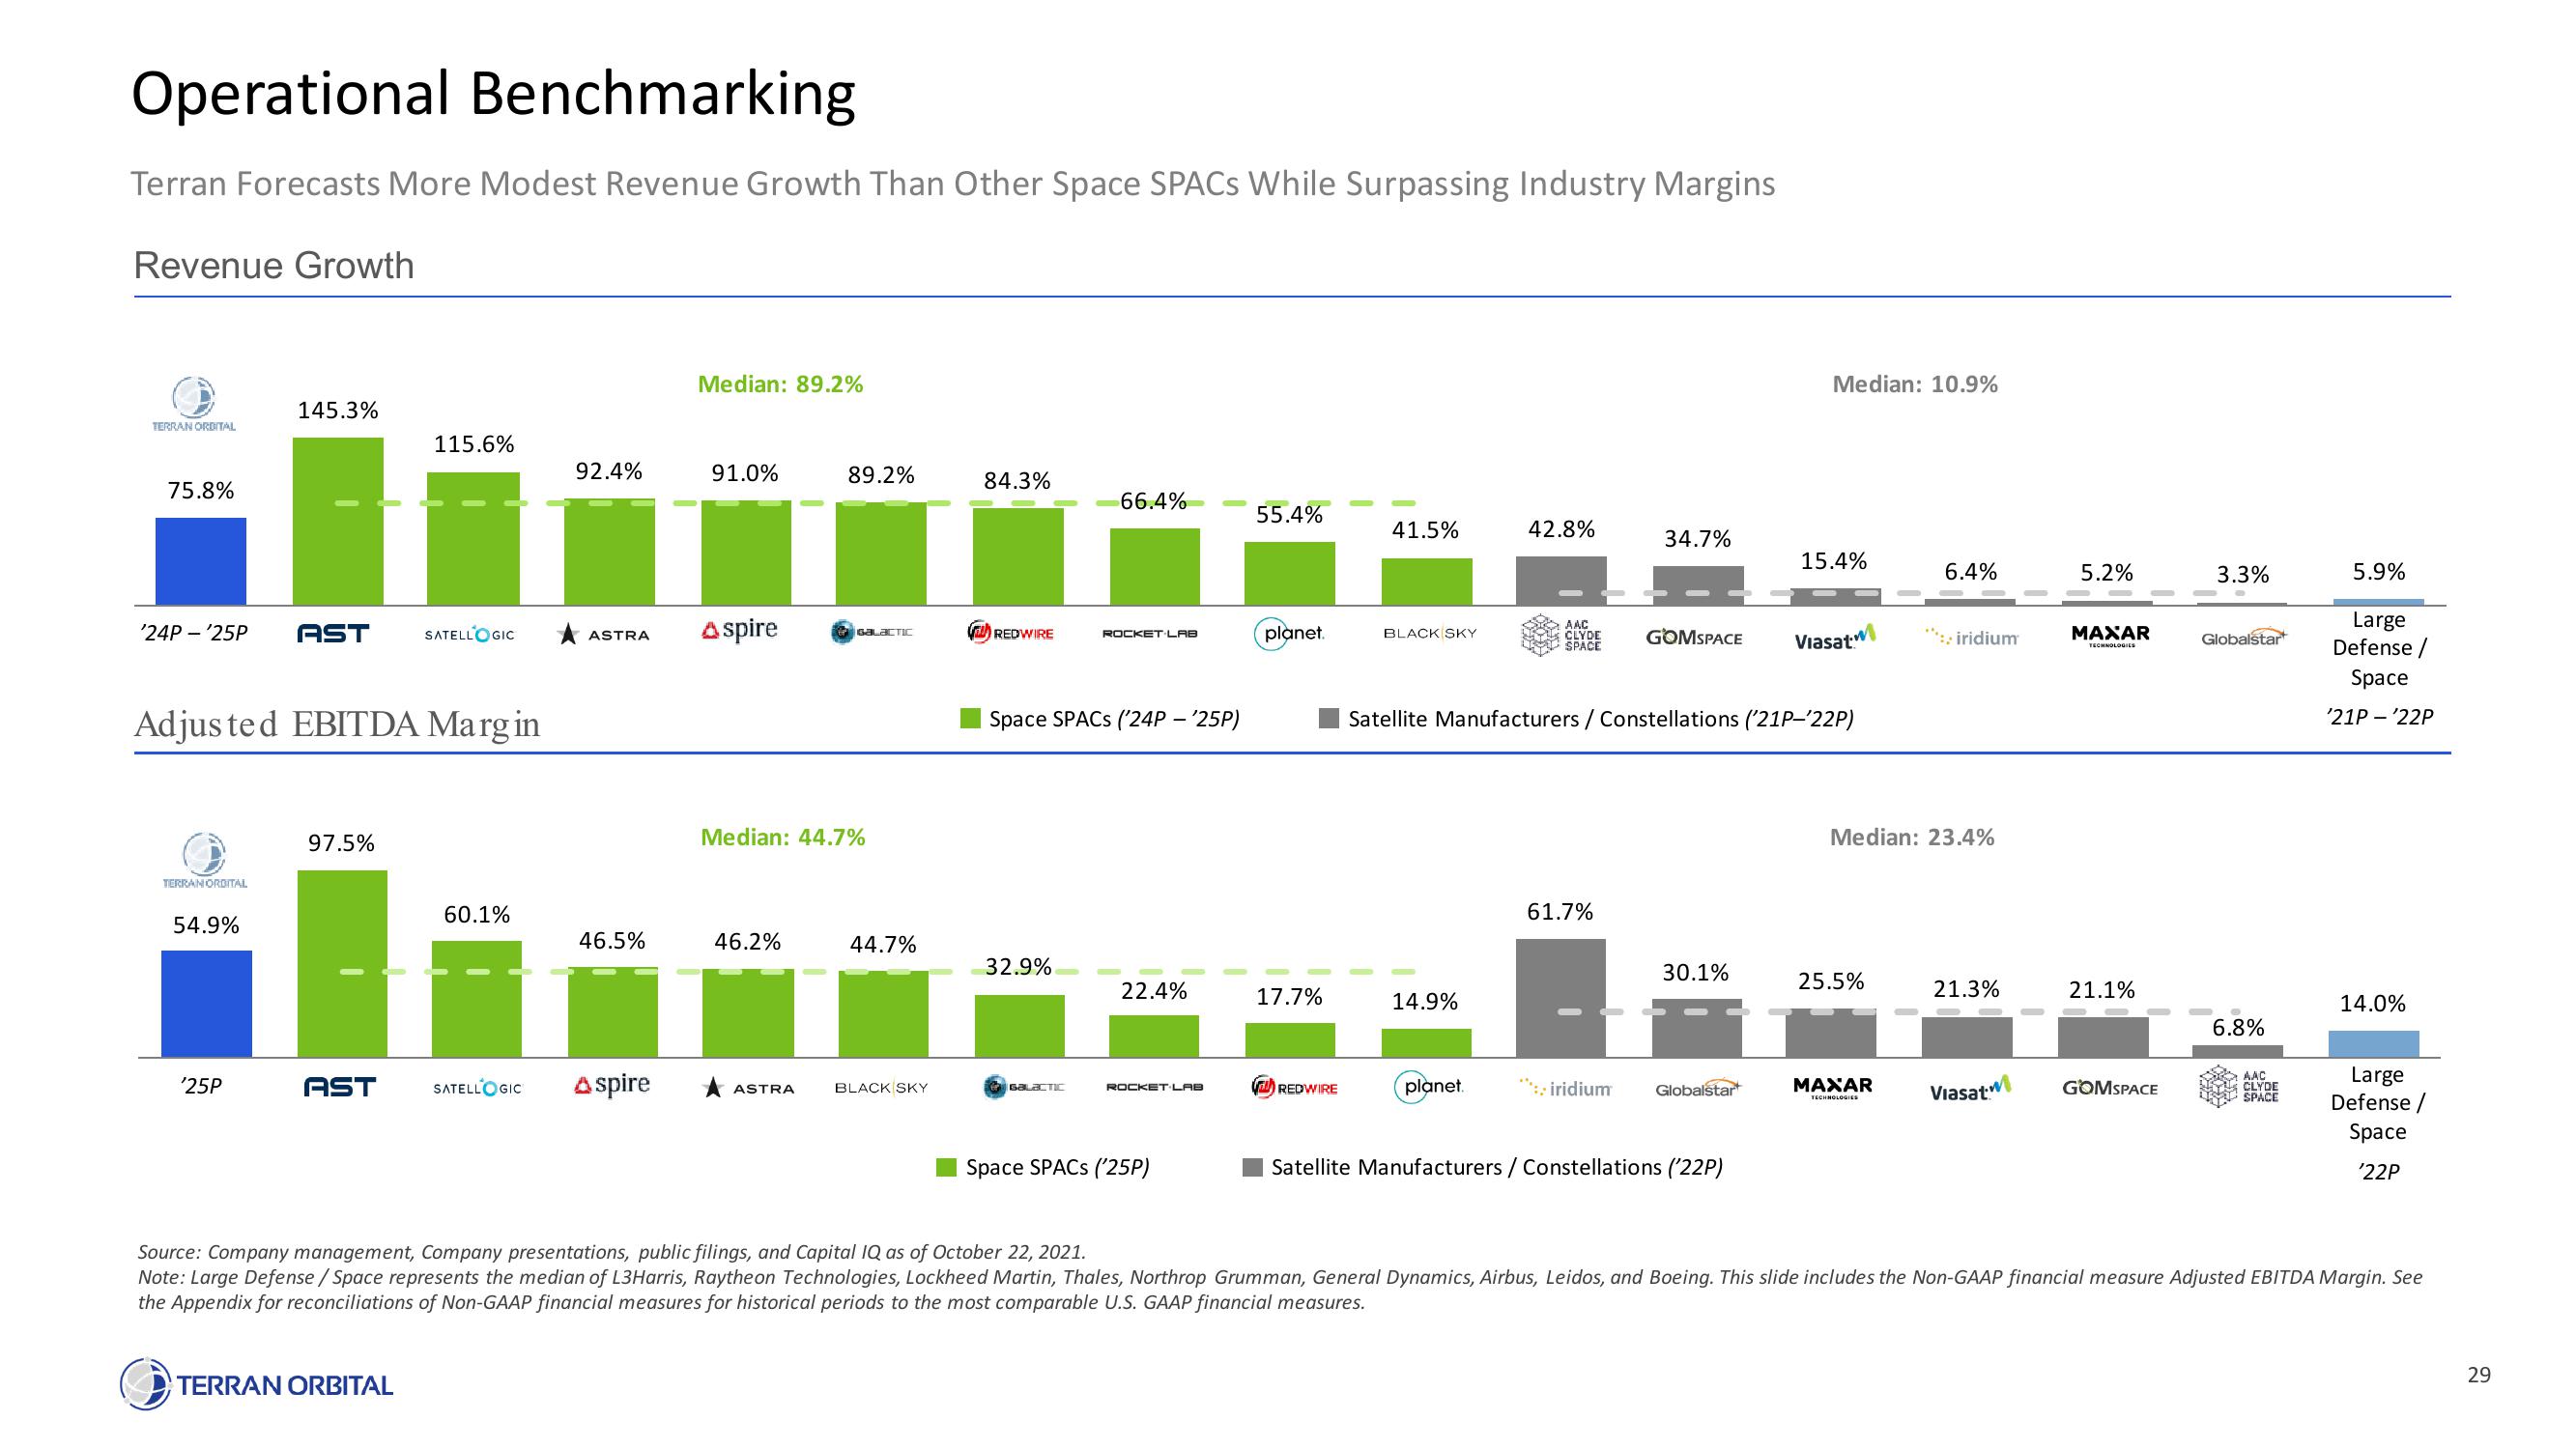
Terran Forecasts More Modest Revenue Growth Than Other Space SPACS While Surpassing Industry Margins
Revenue Growth
TERRAN ORDITAL
75.8%
'24P-'25P AST SATELLOGIC
TERRANORDITAL
145.3%
Adjusted EBITDA Margin
54.9%
'25P
115.6%
97.5%
60.1%
AST SATELLOGIC
TERRAN ORBITAL
92.4%
ASTRA
46.5%
Aspire
Median: 89.2%
91.0%
Aspire
46.2%
89.2%
Median: 44.7%
ASTRA
GALACTIC
44.7%
BLACK SKY
84.3%
REDWIRE
32.9%
66.4%
Space SPACS ('24P - '25P)
GALACTIC
ROCKET LAB
22.4%
ROCKET LAB
Space SPACS (25P)
55.4%
planet.
17.7%
REDWIRE
41.5%
BLACK SKY
14.9%
42.8%
planet.
AAC
CLYDE
SPACE
61.7%
34.7%
***: iridium
GOMSPACE
Satellite Manufacturers / Constellations ('21P-'22P)
30.1%
Globalstar
Median: 10.9%
Satellite Manufacturers / Constellations ('22P)
15.4%
Viasat.
25.5%
6.4%
Median: 23.4%
MAXAR
TECHNOLOGIES
***:: iridium
21.3%
Viasat
5.2%
MAXAR
TECHNOLOGIES
21.1%
GOMSPACE
3.3%
Globalstar
6.8%
AAC
CLYDE
SPACE
5.9%
Large
Defense /
Space
'21P - '22P
14.0%
Large
Defense /
Space
'22P
Source: Company management, Company presentations, public filings, and Capital IQ as of October 22, 2021.
Note: Large Defense /Space represents the median of L3Harris, Raytheon Technologies, Lockheed Martin, Thales, Northrop Grumman, General Dynamics, Airbus, Leidos, and Boeing. This slide includes the Non-GAAP financial measure Adjusted EBITDA Margin. See
the Appendix for reconciliations of Non-GAAP financial measures for historical periods to the most comparable U.S. GAAP financial measures.
29View entire presentation