Bank of America Investment Banking Pitch Book
Revenue
% Growth
Gross Profit
% Margin
Adjusted EBITDA
% Margin
Adjusted EBIT
% Margin
Adjusted EPS
Free Cash Flow
(4)
2008A
$492
199
40%
(0)
(0%)
(9)
(2%)
($0.19)
6
2009A
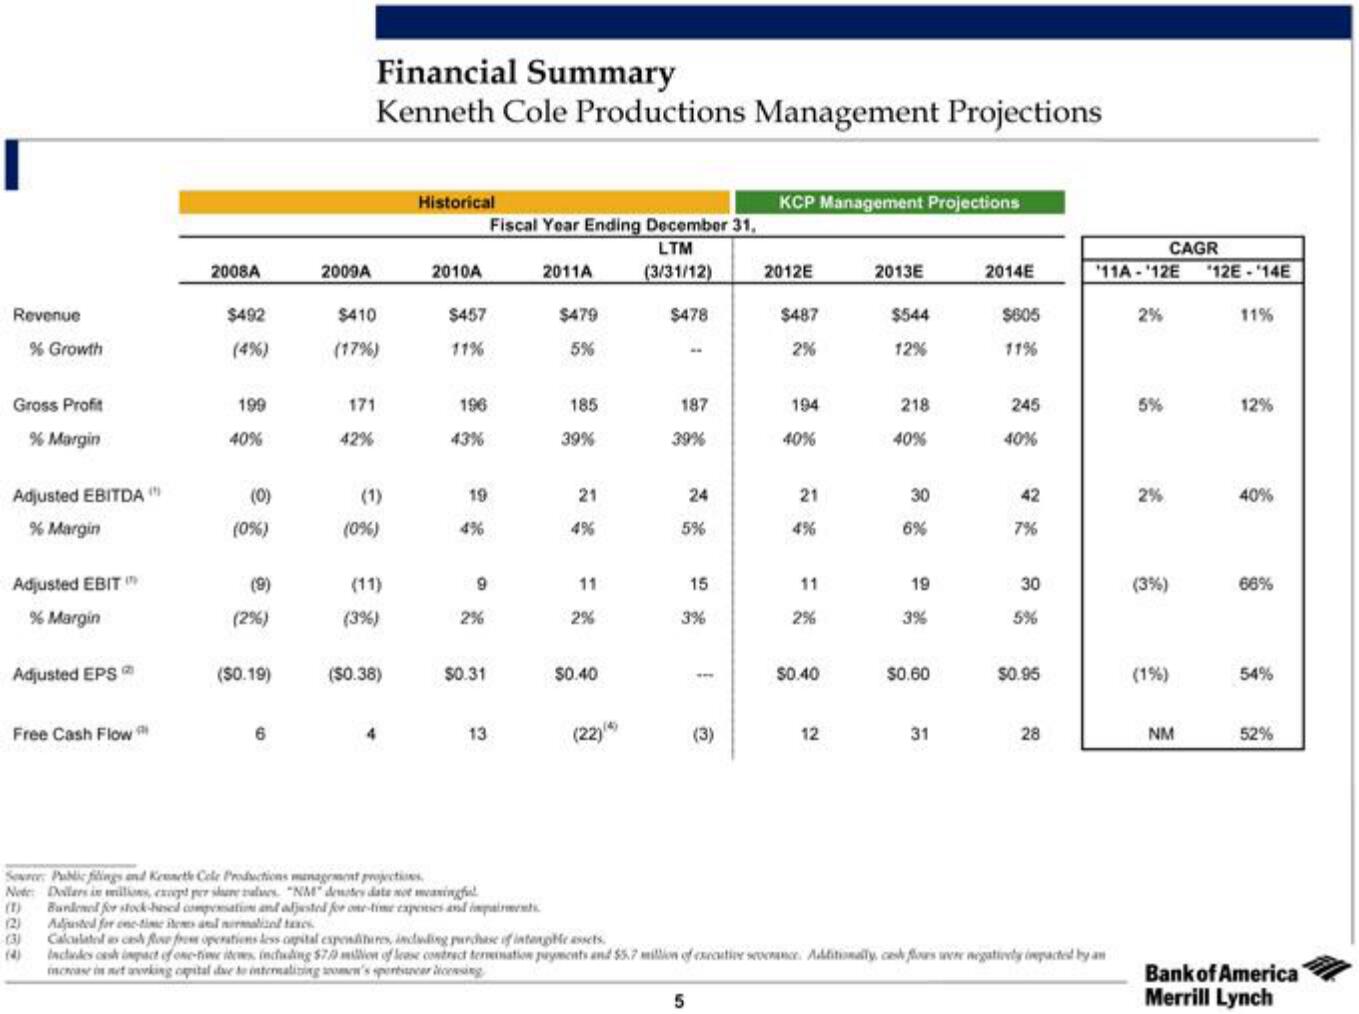
Financial Summary
Kenneth Cole Productions Management Projections
$410
(17%)
171
42%
(0%)
(11)
(3%)
($0.38)
4
Historical
2010A
$457
11%
196
43%
19
4%
9
2%
$0.31
13
Fiscal Year Ending December 31,
LTM
(3/31/12)
Source: Public filings and Kenneth Cole Productions management projections
Note: Dollars in millions, et per share values. NM dentes date not meaningful
(1) Bunlenel for stock-based compensation and adjusted for one-time expenses and impairments
2011A
$479
5%
185
39%
21
4%
11
2%
$0.40
(22)
$478
-
187
39%
24
5%
5
15
3%
-
(3)
KCP Management Projections
2012E
$487
2%
194
40%
21
4%
11
2%
$0.40
12
2013E
$544
12%
218
40%
30
6%
19
3%
$0.60
31
2014E
$605
11%
245
40%
42
7%
30
5%
$0.95
28
Adjusted for one-time items and nirmalized taxes
Calculated as cash flow from operations less opital expenditures, including purchase of intanghe assets.
Includes cash impact of one-time items including $70 million of lease contract termination payments and $5.7 million of executive sevce. Additionally, cash flows were negatively impacted by an
increase in net arking capital due to internalizing women's sportswear licensing
'11A-'12E *12E-14E
2%
5%
2%
(3%)
CAGR
(1%)
NM
11%
12%
40%
66%
54%
52%
Bank of America
Merrill LynchView entire presentation