Wish SPAC Presentation Deck slide image

Wish SPAC Presentation Deck

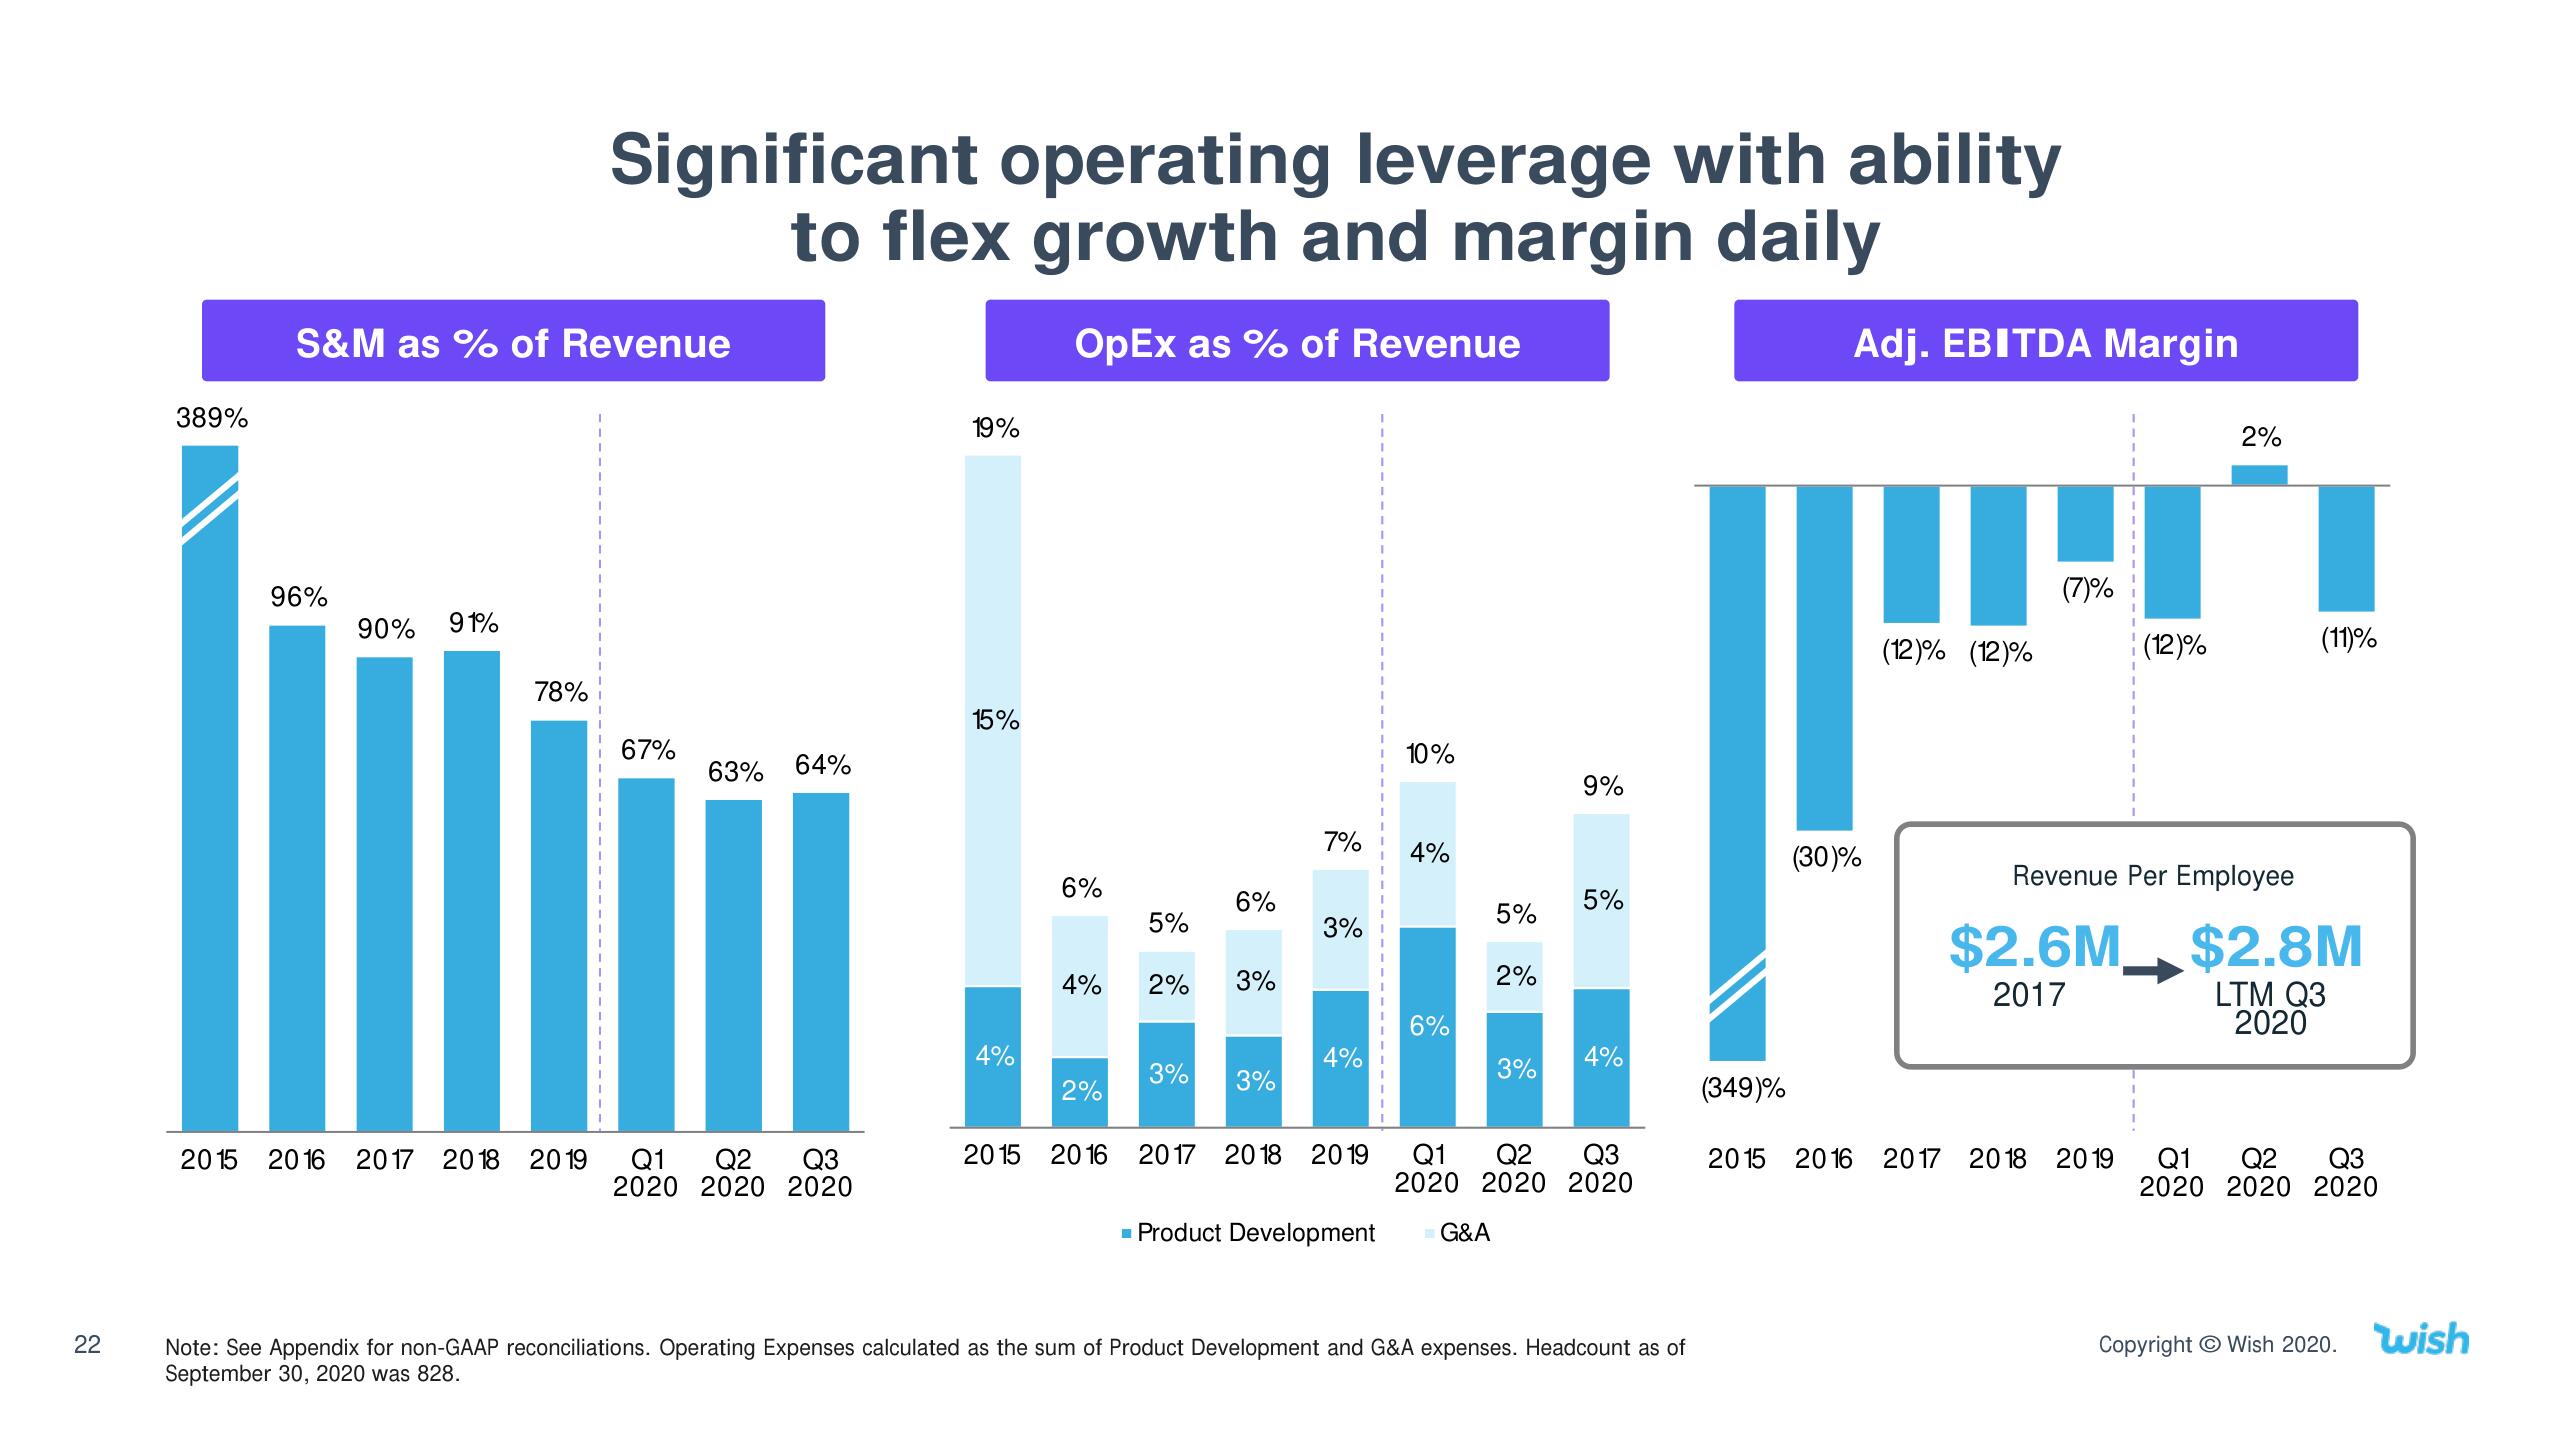
22 389% S&M as % of Revenue 96% 90% 91% Significant operating leverage with ability to flex growth and margin daily OpEx as % of Revenue 78% 67% 63% 64% 2015 2016 2017 2018 2019 Q1 Q2 Q3 2020 2020 2020 19% 15% 4% 2015 6% 4% 2% 5% 6% 2% 3% 3% 3% 7% 3% 4% 2016 2017 2018 2019 10% 4% 6% 5% 2% ■ Product Development G&A 3% 9% 5% 4% Q1 Q2 Q3 2020 2020 2020 Note: See Appendix for non-GAAP reconciliations. Operating Expenses calculated as the sum of Product Development and G&A expenses. Headcount as of September 30, 2020 was 828. (349)% Adj. EBITDA Margin (30)% (12)% (12)% (7)% Re (12)% 2015 2016 2017 2018 2019 2% ue Per Employee $2.6M $2.8M 2017 (11)% LTM Q3 2020 Q1 Q2 Q3 2020 2020 2020 Copyright Wish 2020. wish
View entire presentation