Maersk Investor Presentation Deck
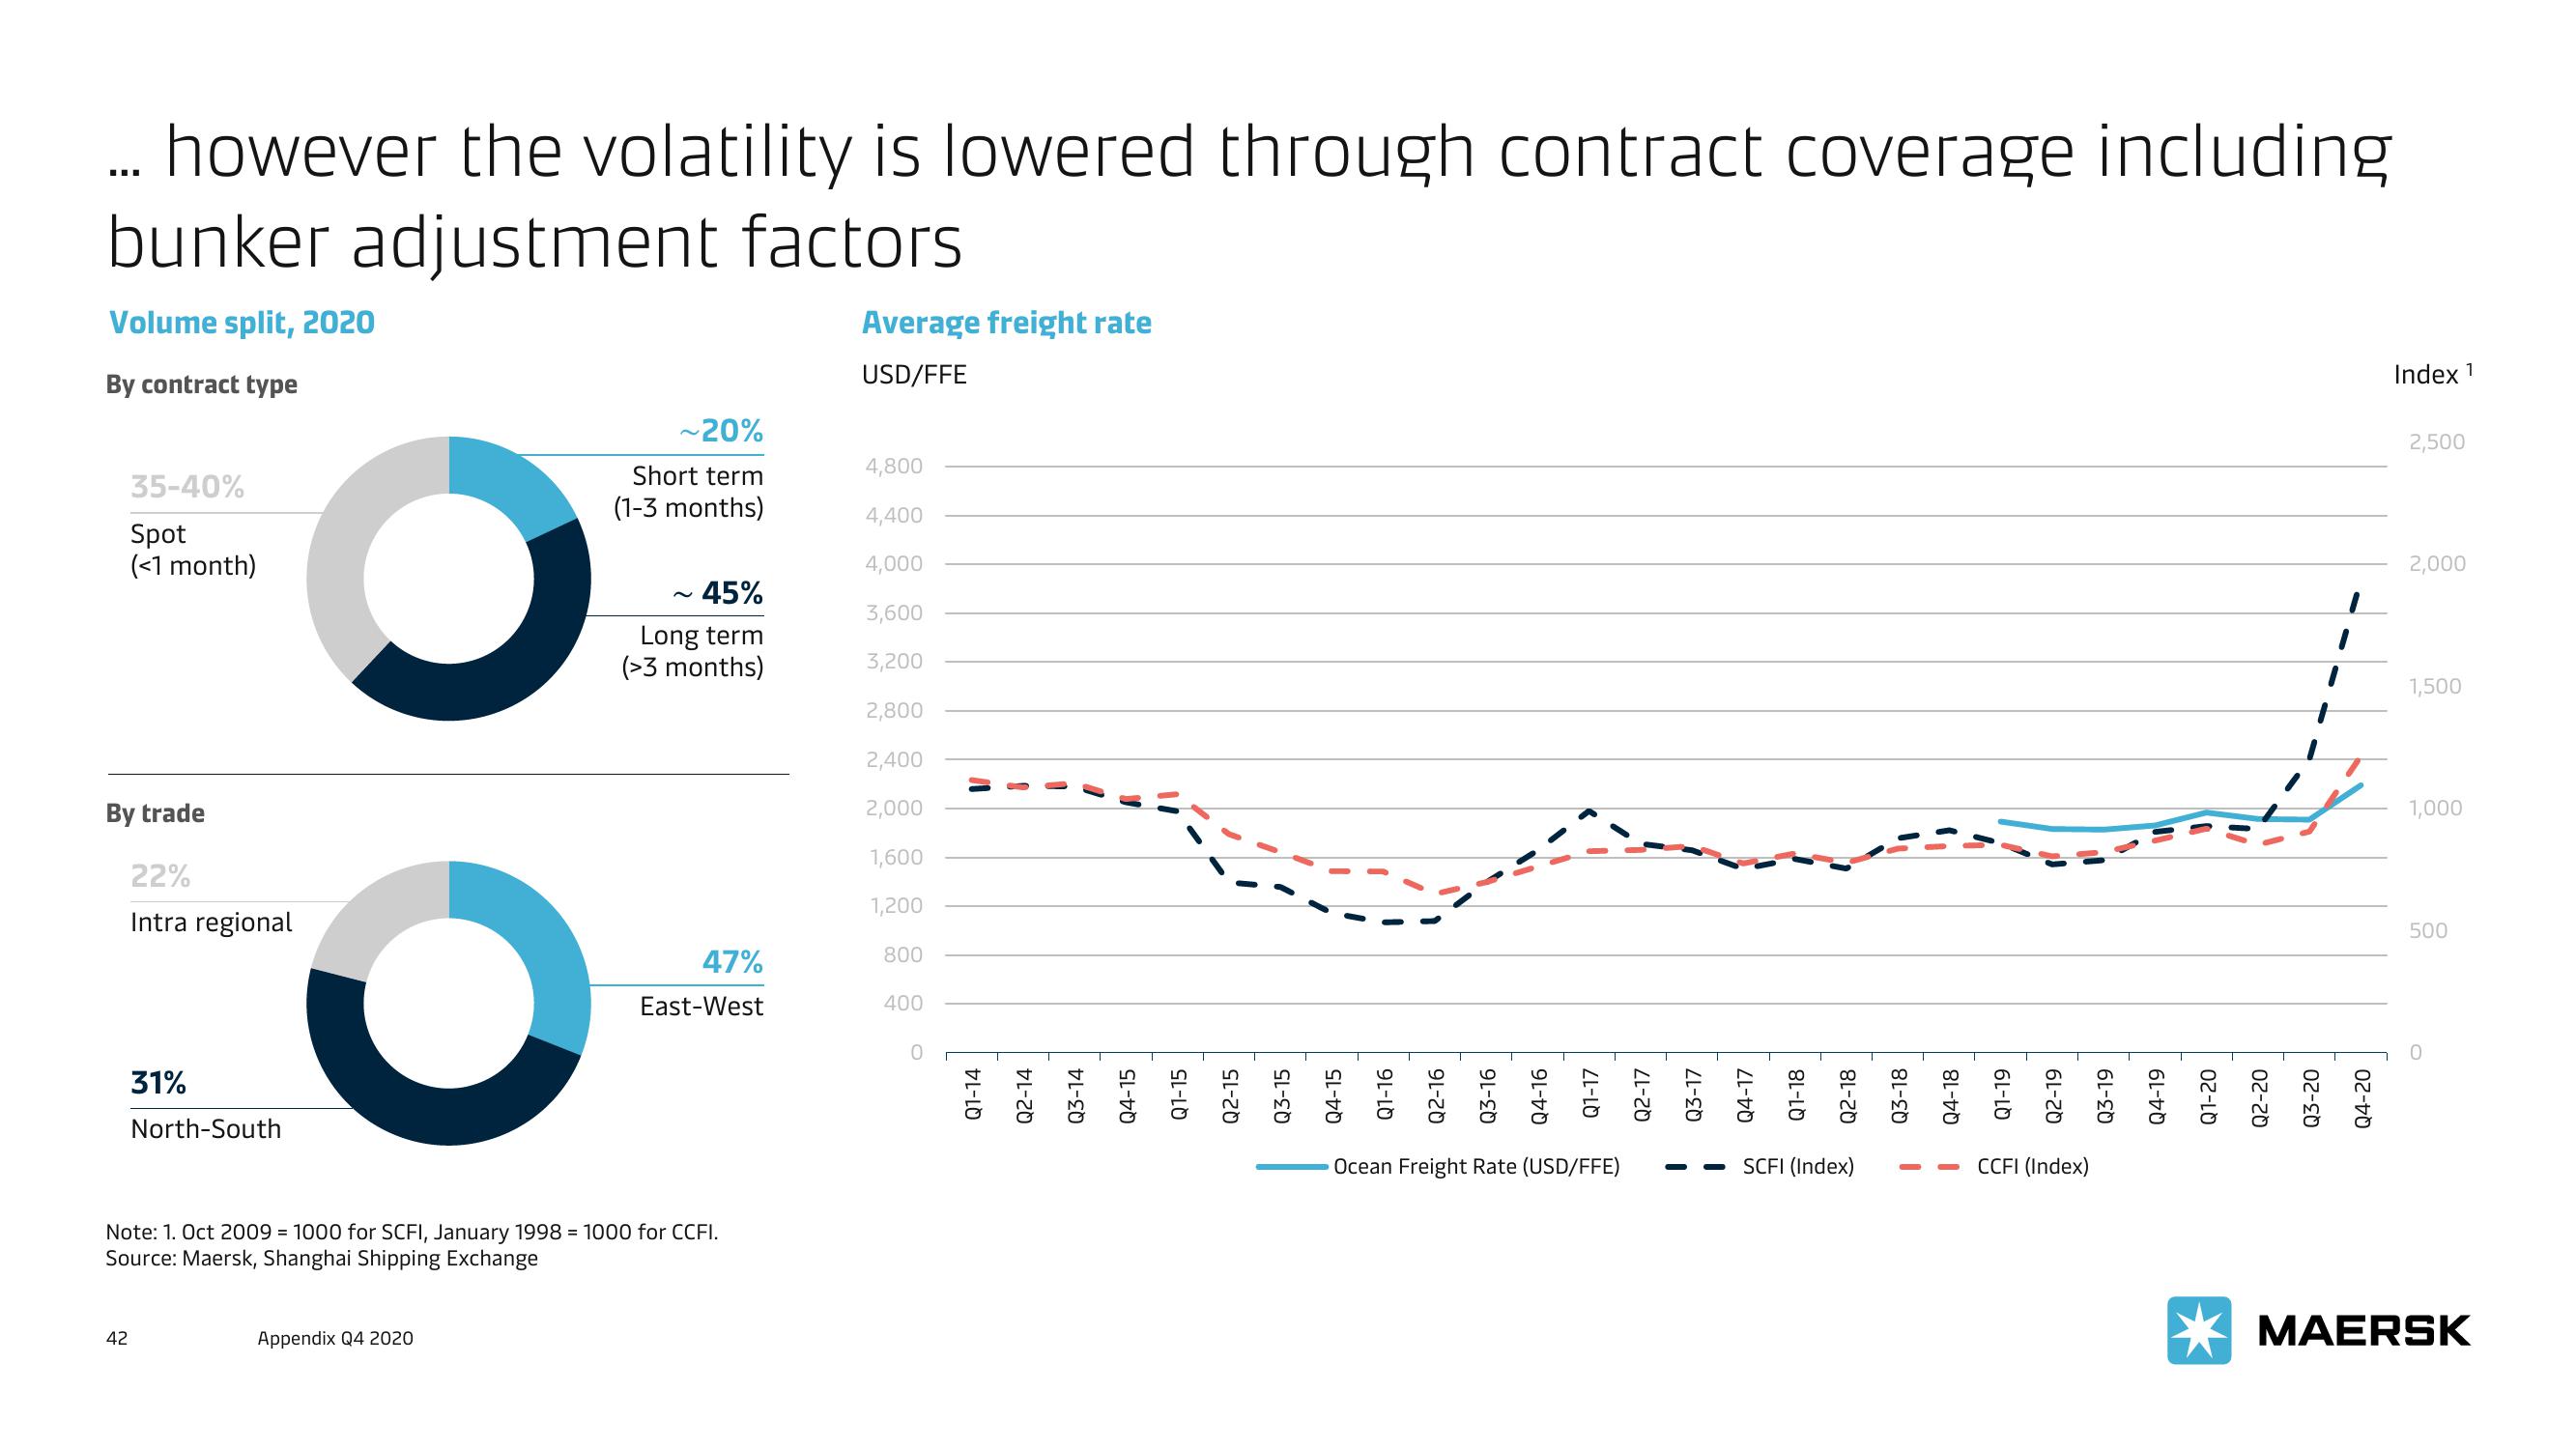
however the volatility is lowered through contract coverage including
bunker adjustment factors
Volume split, 2020
By contract type
III
O
O
Note: 1. Oct 2009 = 1000 for SCFI, January 1998 = 1000 for CCFI.
Source: Maersk, Shanghai Shipping Exchange
35-40%
Spot
(<1 month)
By trade
22%
Intra regional
42
31%
North-South
~20%
Short term
(1-3 months)
Appendix Q4 2020
45%
Long term
(>3 months)
47%
East-West
Average freight rate
USD/FFE
4,800
4,400
4,000
3,600
3,200
2,800
2,400
2,000
1,600
1,200
800
400
Q1-14
Q2-14
Q3-14
Q4-15
Q1-15
Q2-15
Q3-15
Q4-15
Q1-16
Q2-16
Q3-16
Q4-16
Q1-17
Ocean Freight Rate (USD/FFE)
Q2-17
Q3-17
Q4-17
Q1-18
Q2-18
SCFI (Index)
Q3-18
1
Q4-18
Q1-19
Q2-19
1
CCFI (Index)
Q3-19
Q4-19
Q1-20
Q2-20
Q3-20
1
Q4-20
Index ¹
2,500
2,000
1,500
1,000
500
MAERSKView entire presentation