Experian Investor Presentation Deck slide image

Experian Investor Presentation Deck

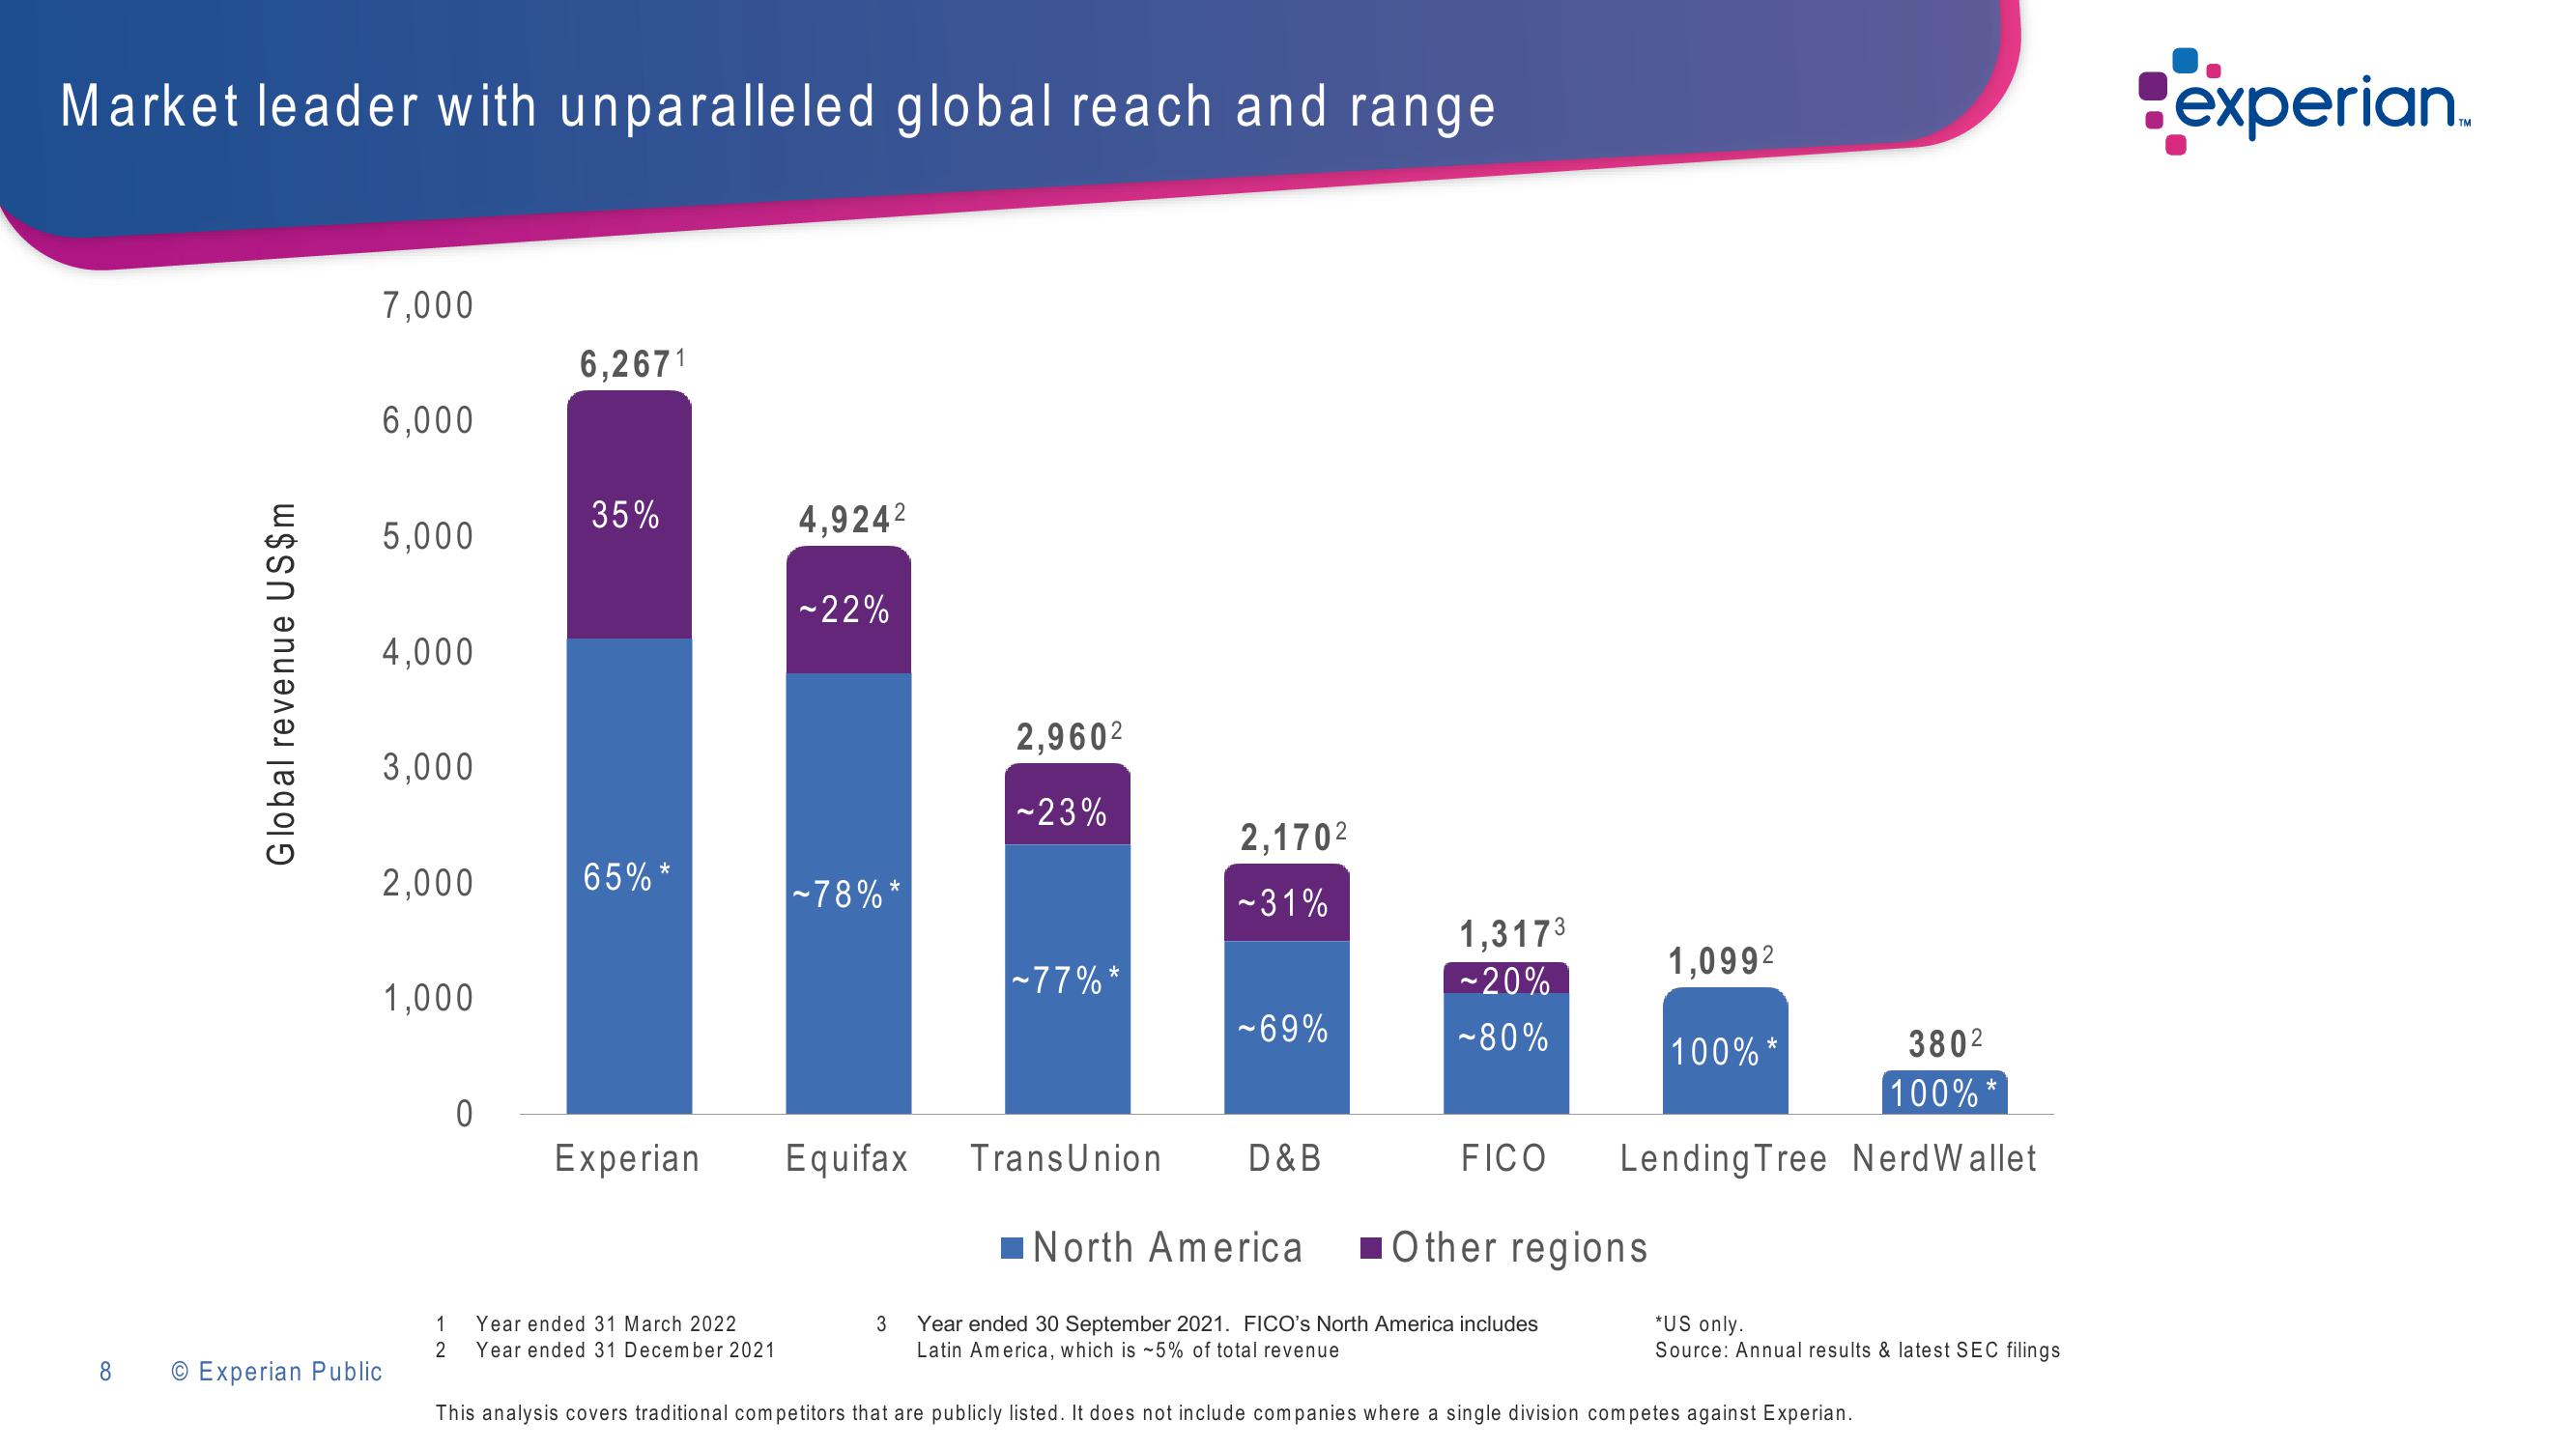
Market leader with unparalleled global reach and range Global revenue US$m 7,000 6,000 5,000 4,000 3,000 2,000 8 Experian Public 1,000 1 2 0 6,2671 35% 65%* Experian Year ended 31 March 2022 Year ended 31 December 2021 4,924² ~22% ~78%* Equifax 2,9602 ~23% ~77%* Trans Union 2,170² ~31% ~69% D&B 1,3173 ~20% -80% FICO North America 3 Year ended 30 September 2021. FICO's North America includes Latin America, which is ~5% of total revenue Other regions 1,099² 380² 100% Lending Tree Nerd Wallet. 100%* * *US only. Source: Annual results & latest SEC filings This analysis covers traditional competitors that are publicly listed. It does not include companies where a single division competes against Experian. experian
View entire presentation