First Merchants Results Presentation Deck
Non-GAAP
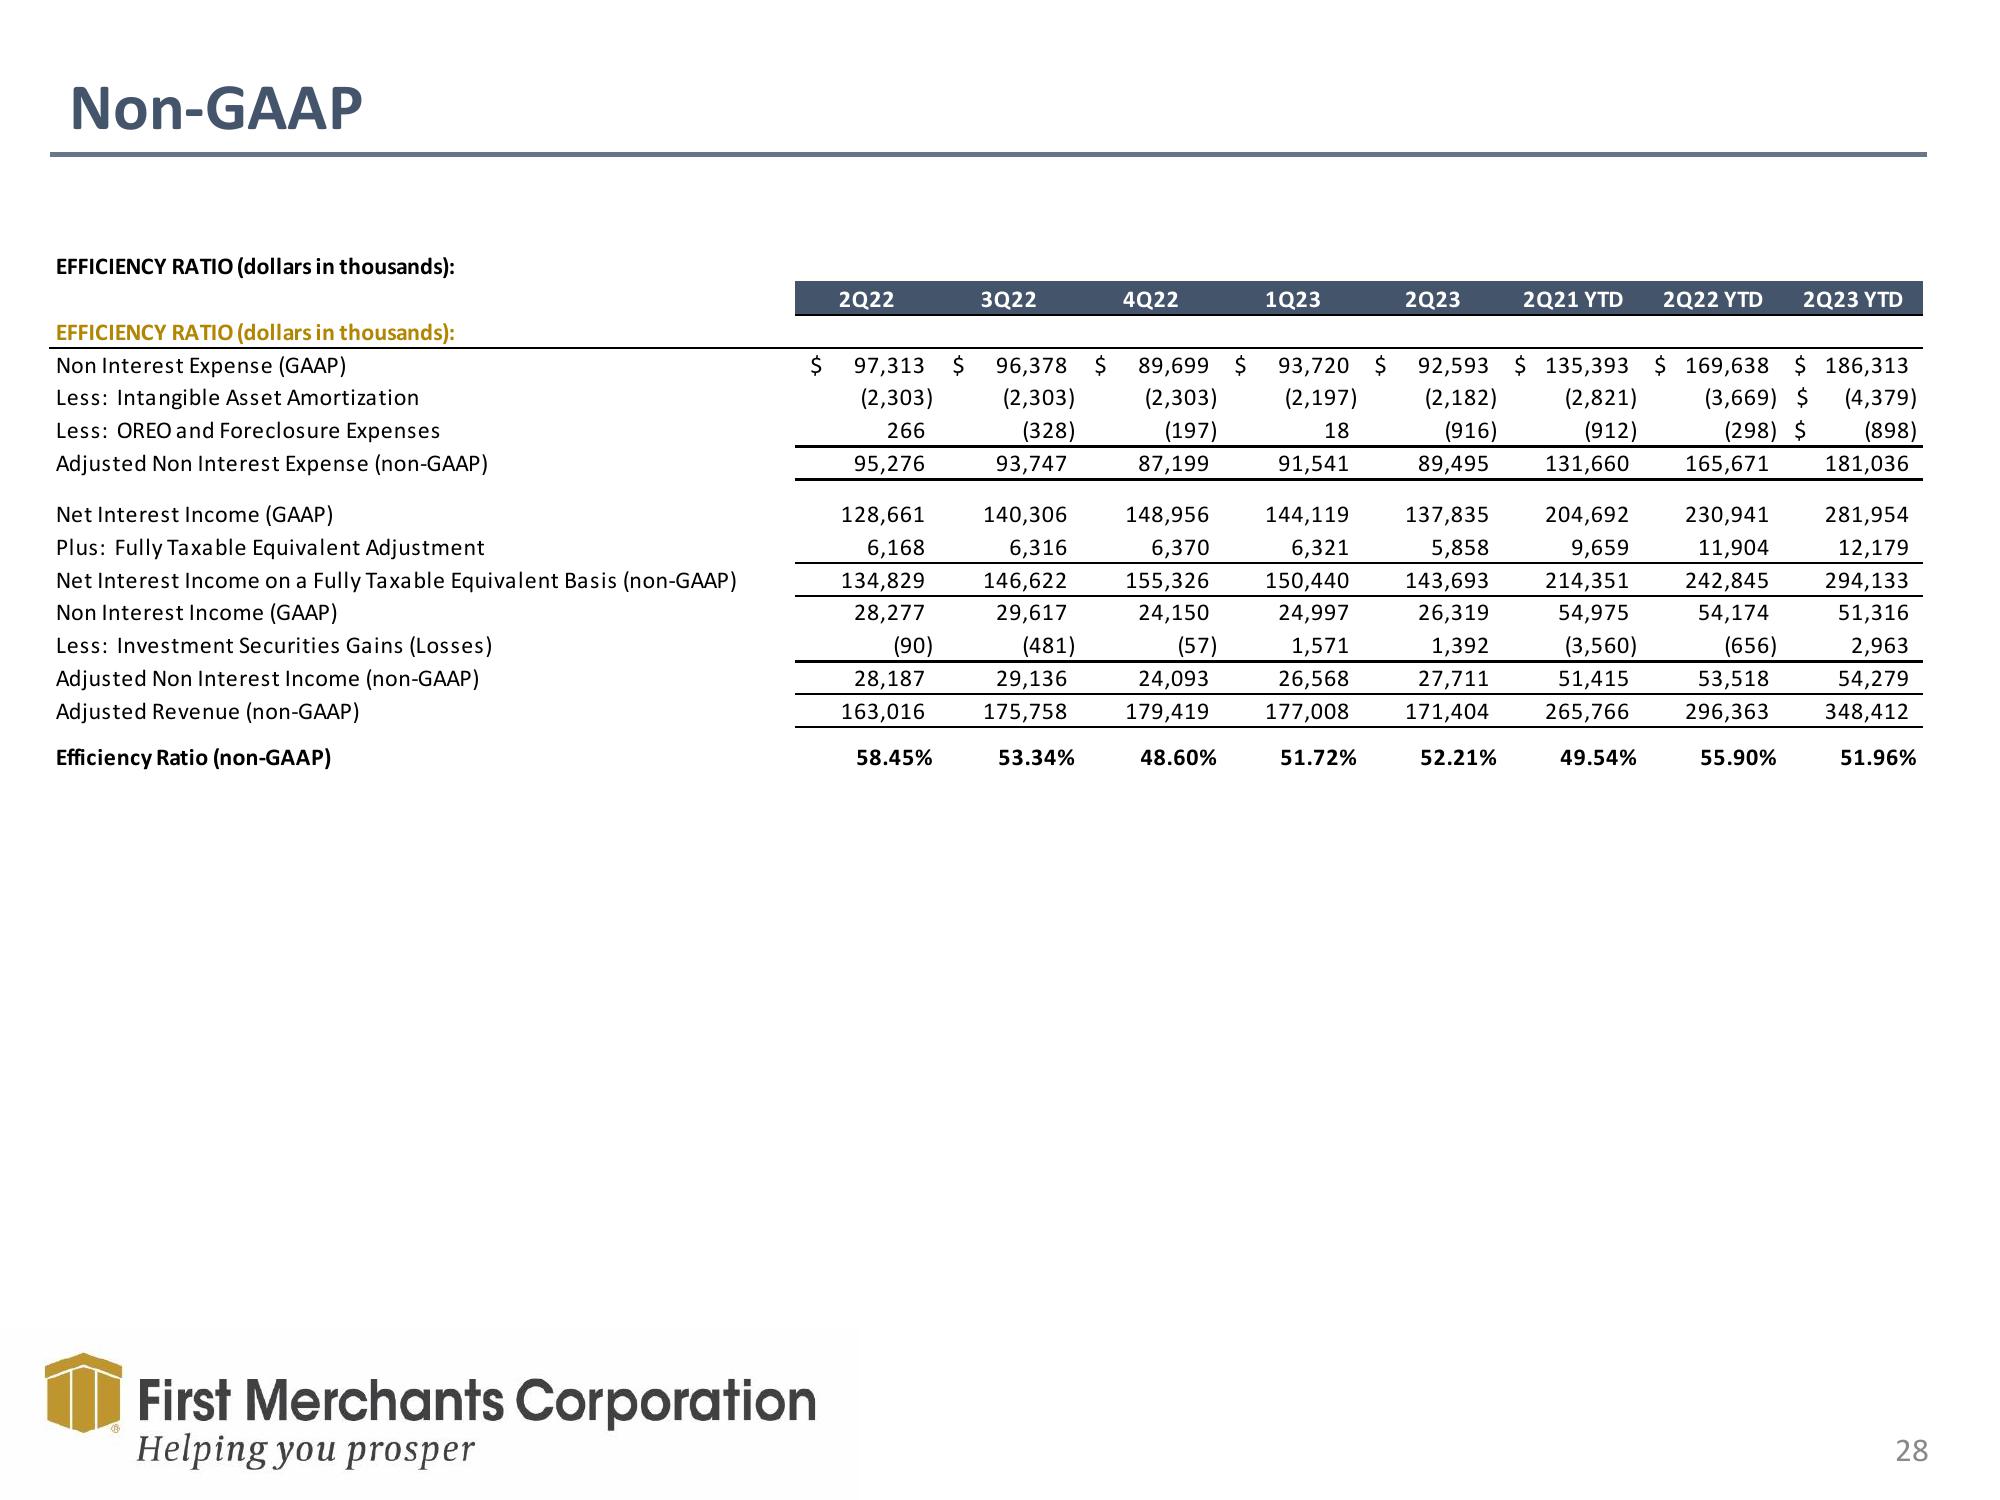
EFFICIENCY RATIO (dollars in thousands):
EFFICIENCY RATIO (dollars in thousands):
Non Interest Expense (GAAP)
Less: Intangible Asset Amortization
Less: OREO and Foreclosure Expenses
Adjusted Non Interest Expense (non-GAAP)
Net Interest Income (GAAP)
Plus: Fully Taxable Equivalent Adjustment
Net Interest Income on a Fully Taxable Equivalent Basis (non-GAAP)
Non Interest Income (GAAP)
Less: Investment Securities Gains (Losses)
Adjusted Non Interest Income (non-GAAP)
Adjusted Revenue (non-GAAP)
Efficiency Ratio (non-GAAP)
$
First Merchants Corporation
Helping you prosper
2Q22
97,313
(2,303)
266
95,276
128,661
6,168
134,829
28,277
(90)
28,187
163,016
58.45%
3Q22
140,306
6,316
146,622
29,617
$ 96,378 $ 89,699 $ 93,720 $
(2,303)
(328)
(2,303)
(197)
87,199
(2,197)
18
91,541
93,747
(481)
29,136
175,758
4Q22
53.34%
1Q23
148,956 144,119
6,370
155,326
24,150
(57)
24,093
179,419
48.60%
6,321
150,440
24,997
1,571
26,568
177,008
51.72%
2Q23
2Q21 YTD 2Q22 YTD
92,593 $ 135,393 $ 169,638 $ 186,313
(2,182) (2,821) (3,669) $ (4,379)
(916)
(912)
(298) $ (898)
89,495 131,660
181,036
165,671
204,692
137,835
5,858
9,659
214,351
143,693
26,319
54,975
1,392
(3,560)
27,711
51,415
171,404 265,766
52.21%
49.54%
2Q23 YTD
230,941
11,904
242,845
54,174
(656)
53,518
296,363
55.90%
281,954
12,179
294,133
51,316
2,963
54,279
348,412
51.96%
28View entire presentation