XP Inc Results Presentation Deck
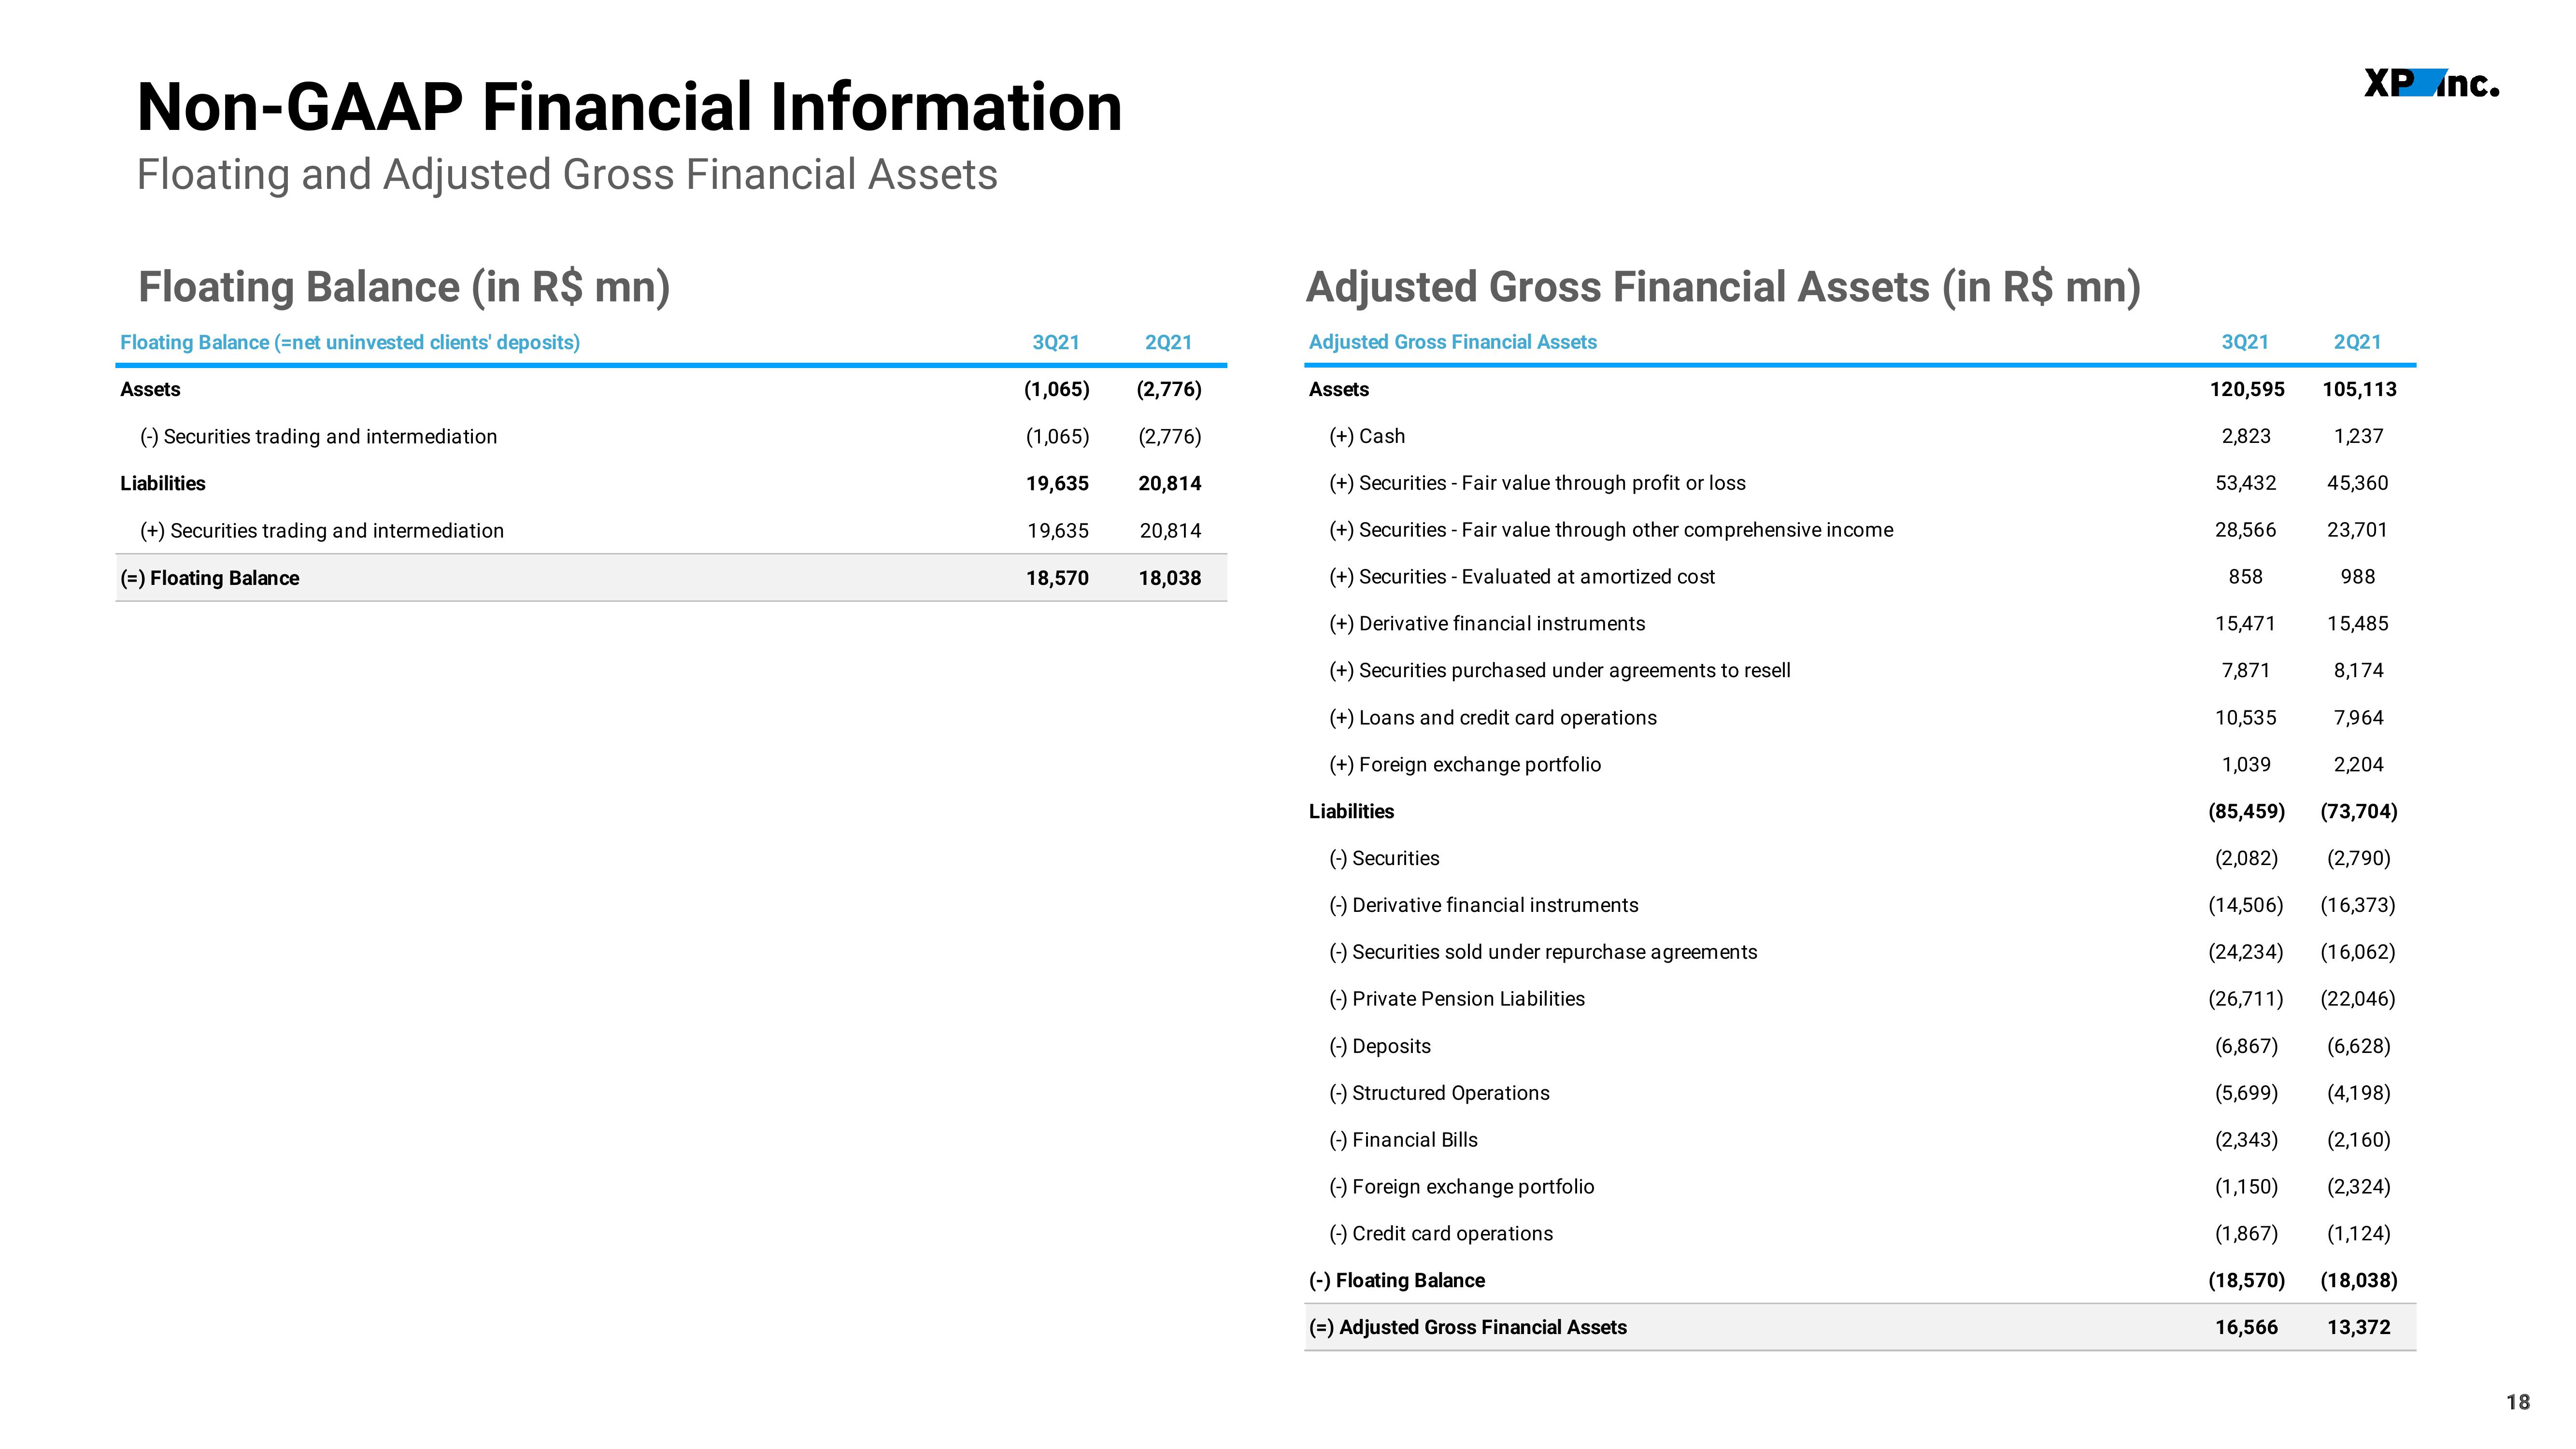
Non-GAAP Financial Information
Floating and Adjusted Gross Financial Assets
Floating Balance (in R$ mn)
Floating Balance (=net uninvested clients' deposits)
Assets
(-) Securities trading and intermediation
Liabilities
(+) Securities trading and intermediation
(=) Floating Balance
3Q21
(1,065)
(1,065)
19,635
19,635
18,570
2Q21
(2,776)
(2,776)
20,814
20,814
18,038
Adjusted Gross Financial Assets (in R$ mn)
Adjusted Gross Financial Assets
Assets
(+) Cash
(+) Securities - Fair value through profit or loss
(+) Securities - Fair value through other comprehensive income
(+) Securities - Evaluated at amortized cost
(+) Derivative financial instruments
(+) Securities purchased under agreements to resell
(+) Loans and credit card operations
(+) Foreign exchange portfolio
Liabilities
(-) Securities
(-) Derivative financial instruments
(-) Securities sold under repurchase agreements
(-) Private Pension Liabilities
(-) Deposits
(-) Structured Operations
(-) Financial Bills
(-) Foreign exchange portfolio
(-) Credit card operations
(-) Floating Balance
(=) Adjusted Gross Financial Assets
3Q21
120,595
2,823
53,432
28,566
858
XP Inc.
2Q21
105,113
1,237
45,360
23,701
988
15,471
7,871
10,535
15,485
8,174
7,964
1,039
(85,459)
(2,082)
2,204
(73,704)
(2,790)
(14,506)
(16,373)
(24,234)
(16,062)
(26,711)
(22,046)
(6,867) (6,628)
(5,699)
(4,198)
(2,343) (2,160)
(1,150)
(2,324)
(1,867)
(1,124)
(18,570)
(18,038)
16,566
13,372
18View entire presentation