Hanmi Financial Results Presentation Deck
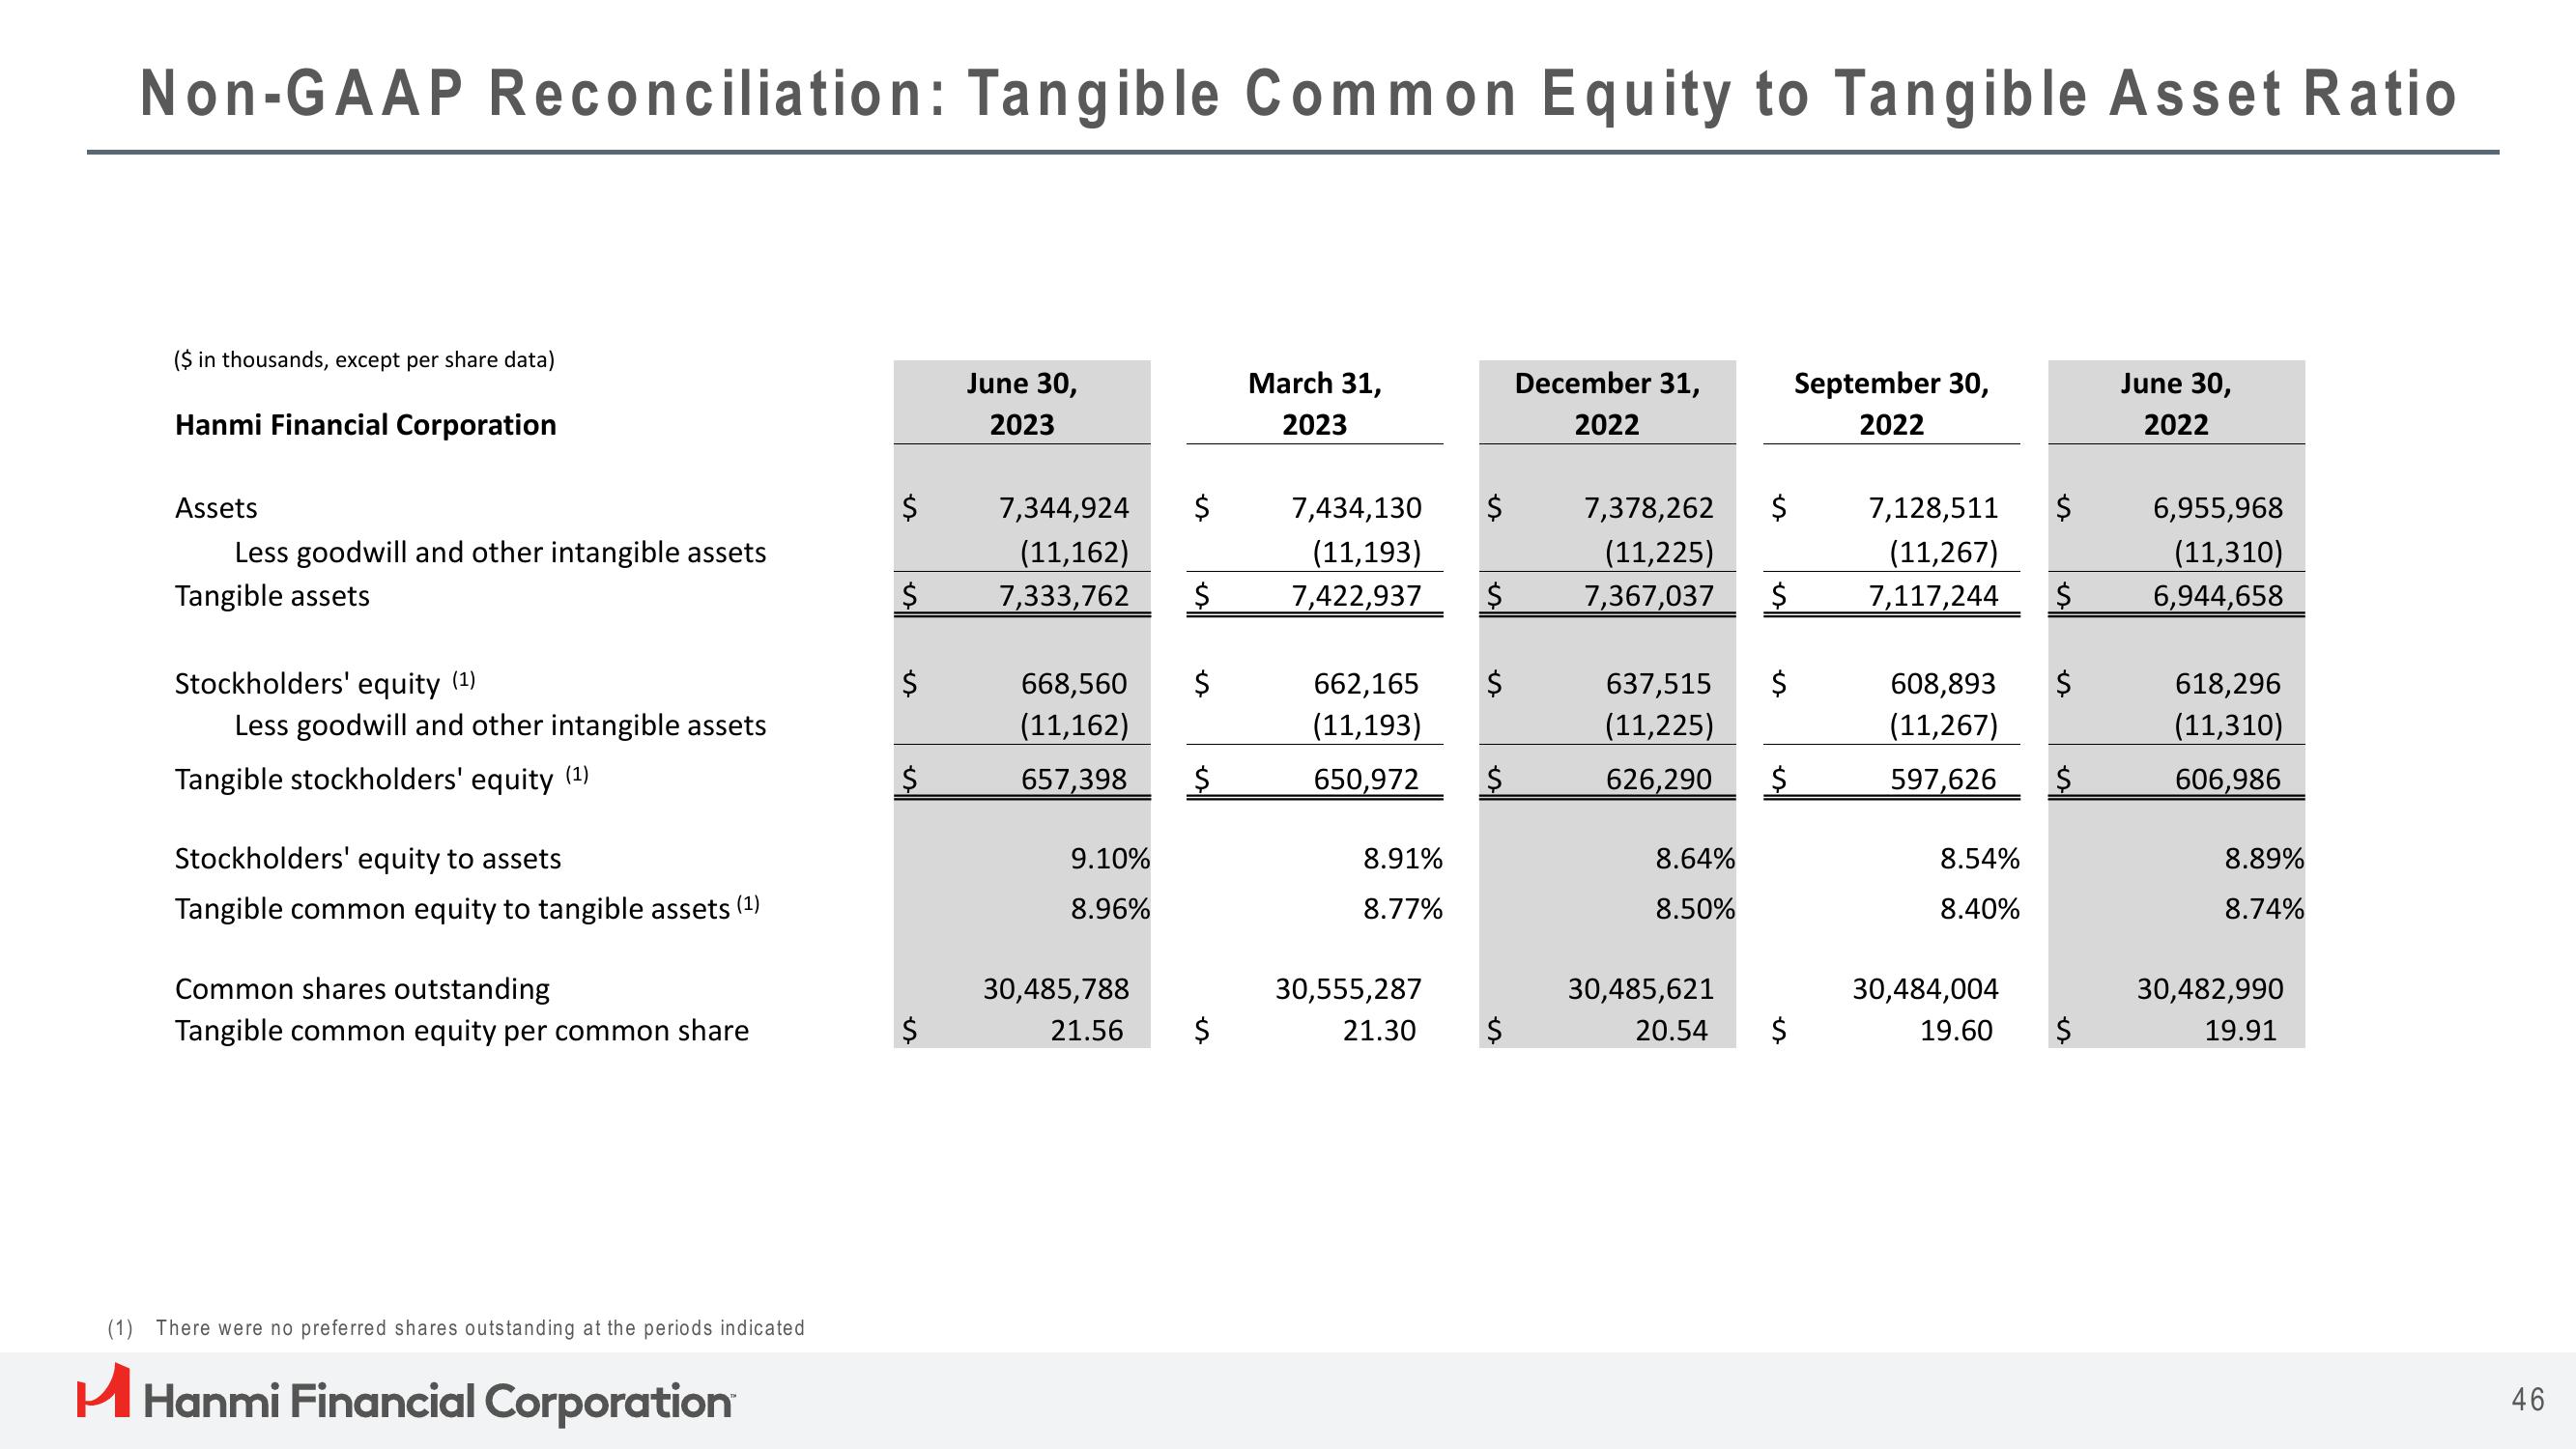
Non-GAAP Reconciliation: Tangible Common Equity to Tangible Asset Ratio
($ in thousands, except per share data)
Hanmi Financial Corporation
Assets
Less goodwill and other intangible assets
Tangible assets
Stockholders' equity (¹)
Less goodwill and other intangible assets
Tangible stockholders' equity (¹)
Stockholders' equity to assets
Tangible common equity to tangible assets (¹)
Common shares outstanding
Tangible common equity per common share
(1) There were no preferred shares outstanding at the periods indicated
H Hanmi Financial Corporation
$
$
$
$
June 30,
2023
7,344,924 $
(11,162)
7,333,762
9.10%
8.96%
$
668,560
(11,162)
657,398 $
30,485,788
21.56
$
March 31,
2023
7,434,130 $
(11,193)
7,422,937
662,165
(11,193)
650,972
8.91%
8.77%
30,555,287
21.30
December 31,
2022
7,378,262 $ 7,128,511
(11,225)
(11,267)
$ 7,367,037
7,117,244 $
$
637,515 $
(11,225)
626,290 $
8.64%
8.50%
$
30,485,621
20.54
September 30,
2022
608,893 $
(11,267)
597,626 $
8.54%
8.40%
$
30,484,004
19.60
$
June 30,
2022
6,955,968
(11,310)
6,944,658
618,296
(11,310)
606,986
8.89%
8.74%
30,482,990
19.91
46View entire presentation