Samsara Investor Presentation Deck
30
Samsara Inc. Confidential.
samsara
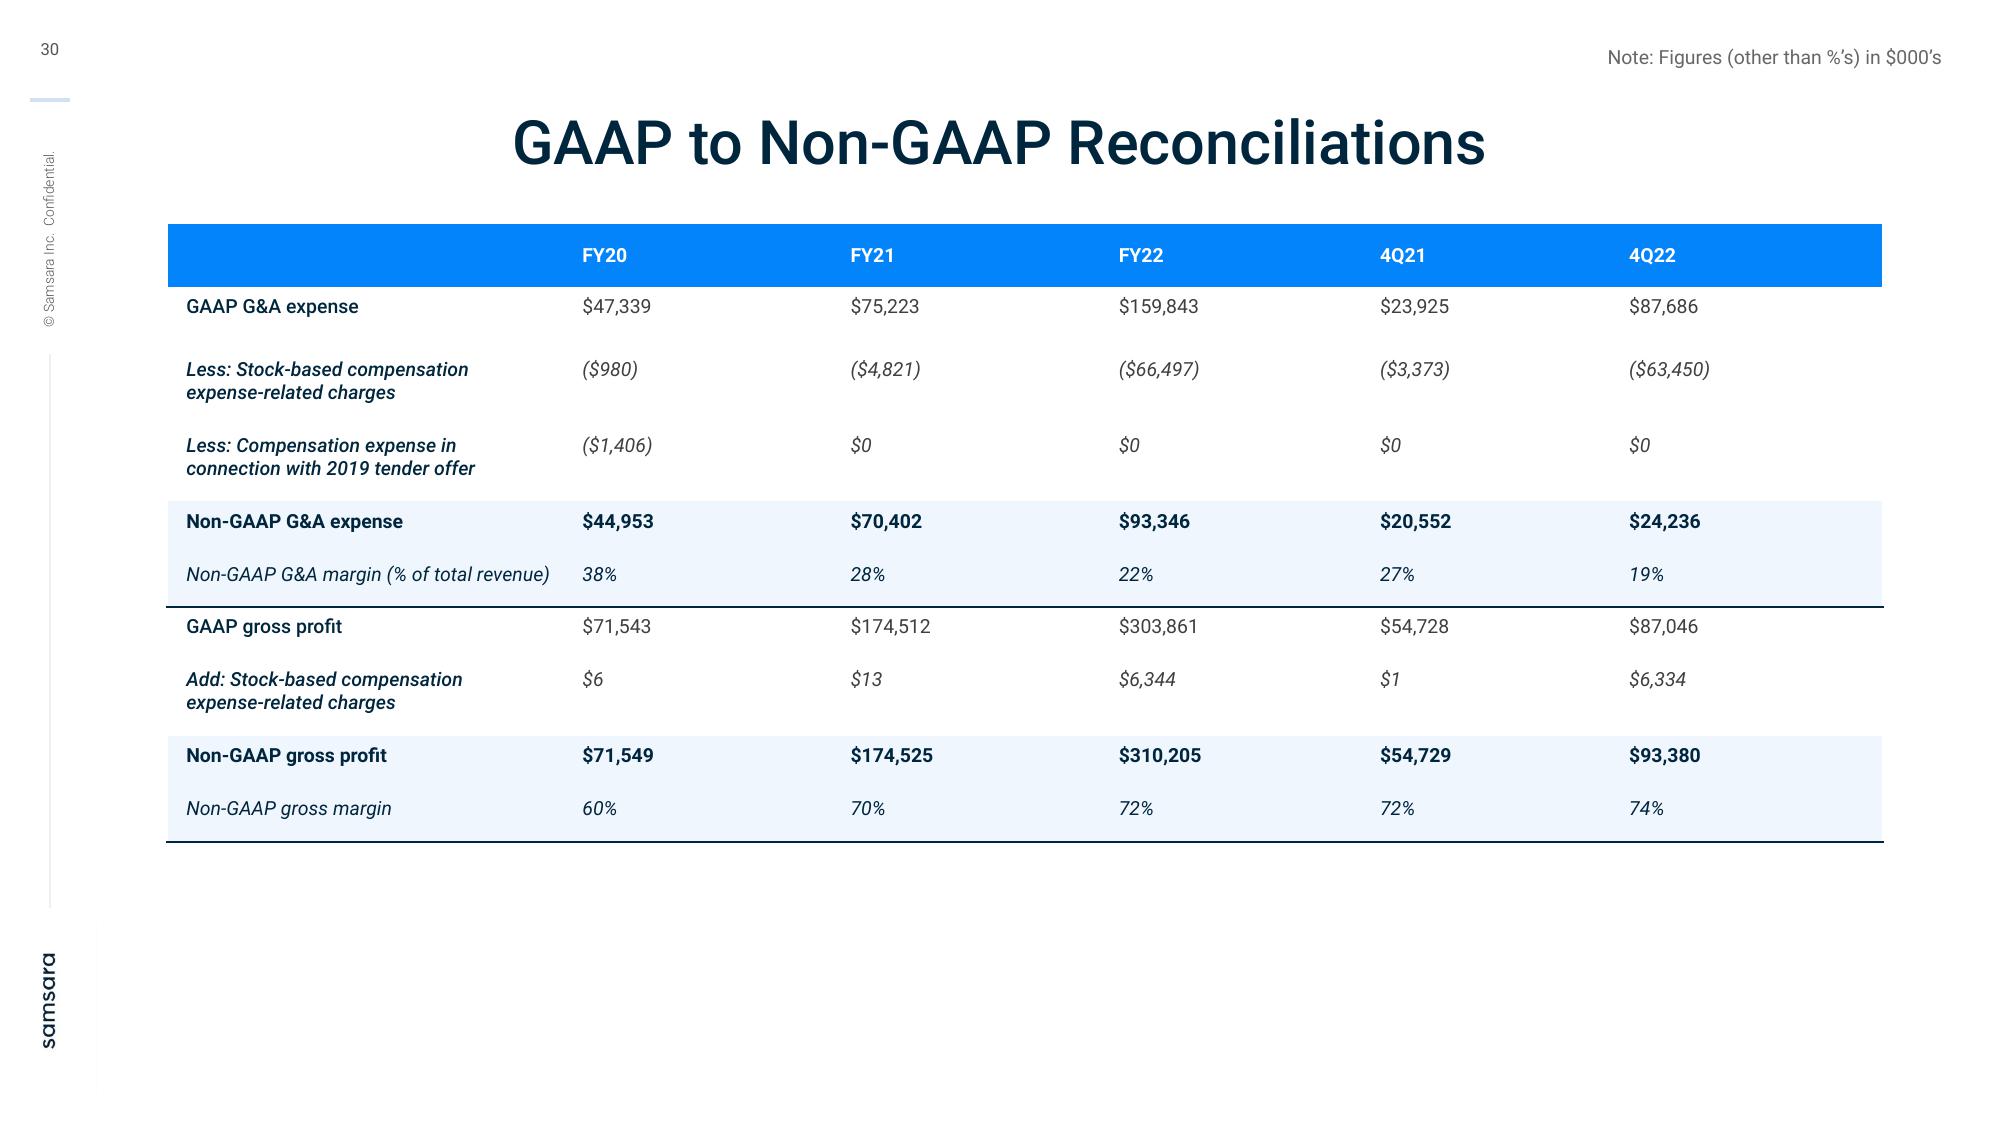
GAAP G&A expense
Less: Stock-based compensation
expense-related charges
GAAP to Non-GAAP Reconciliations
Less: Compensation expense in
connection with 2019 tender offer
Non-GAAP G&A expense
Non-GAAP G&A margin (% of total revenue)
GAAP gross profit
Add: Stock-based compensation
expense-related charges
Non-GAAP gross profit
Non-GAAP gross margin
FY20
$47,339
($980)
($1,406)
$44,953
38%
$71,543
$6
$71,549
60%
FY21
$75,223
($4,821)
$0
$70,402
28%
$174,512
$13
$174,525
70%
FY22
$159,843
($66,497)
$0
$93,346
22%
$303,861
$6,344
$310,205
72%
4Q21
$23,925
($3,373)
$0
$20,552
27%
$54,728
$1
$54,729
72%
Note: Figures (other than %'s) in $000's
4Q22
$87,686
($63,450)
$0
$24,236
19%
$87,046
$6,334
$93,380
74%View entire presentation