Commercial Metals Company Investor Presentation Deck
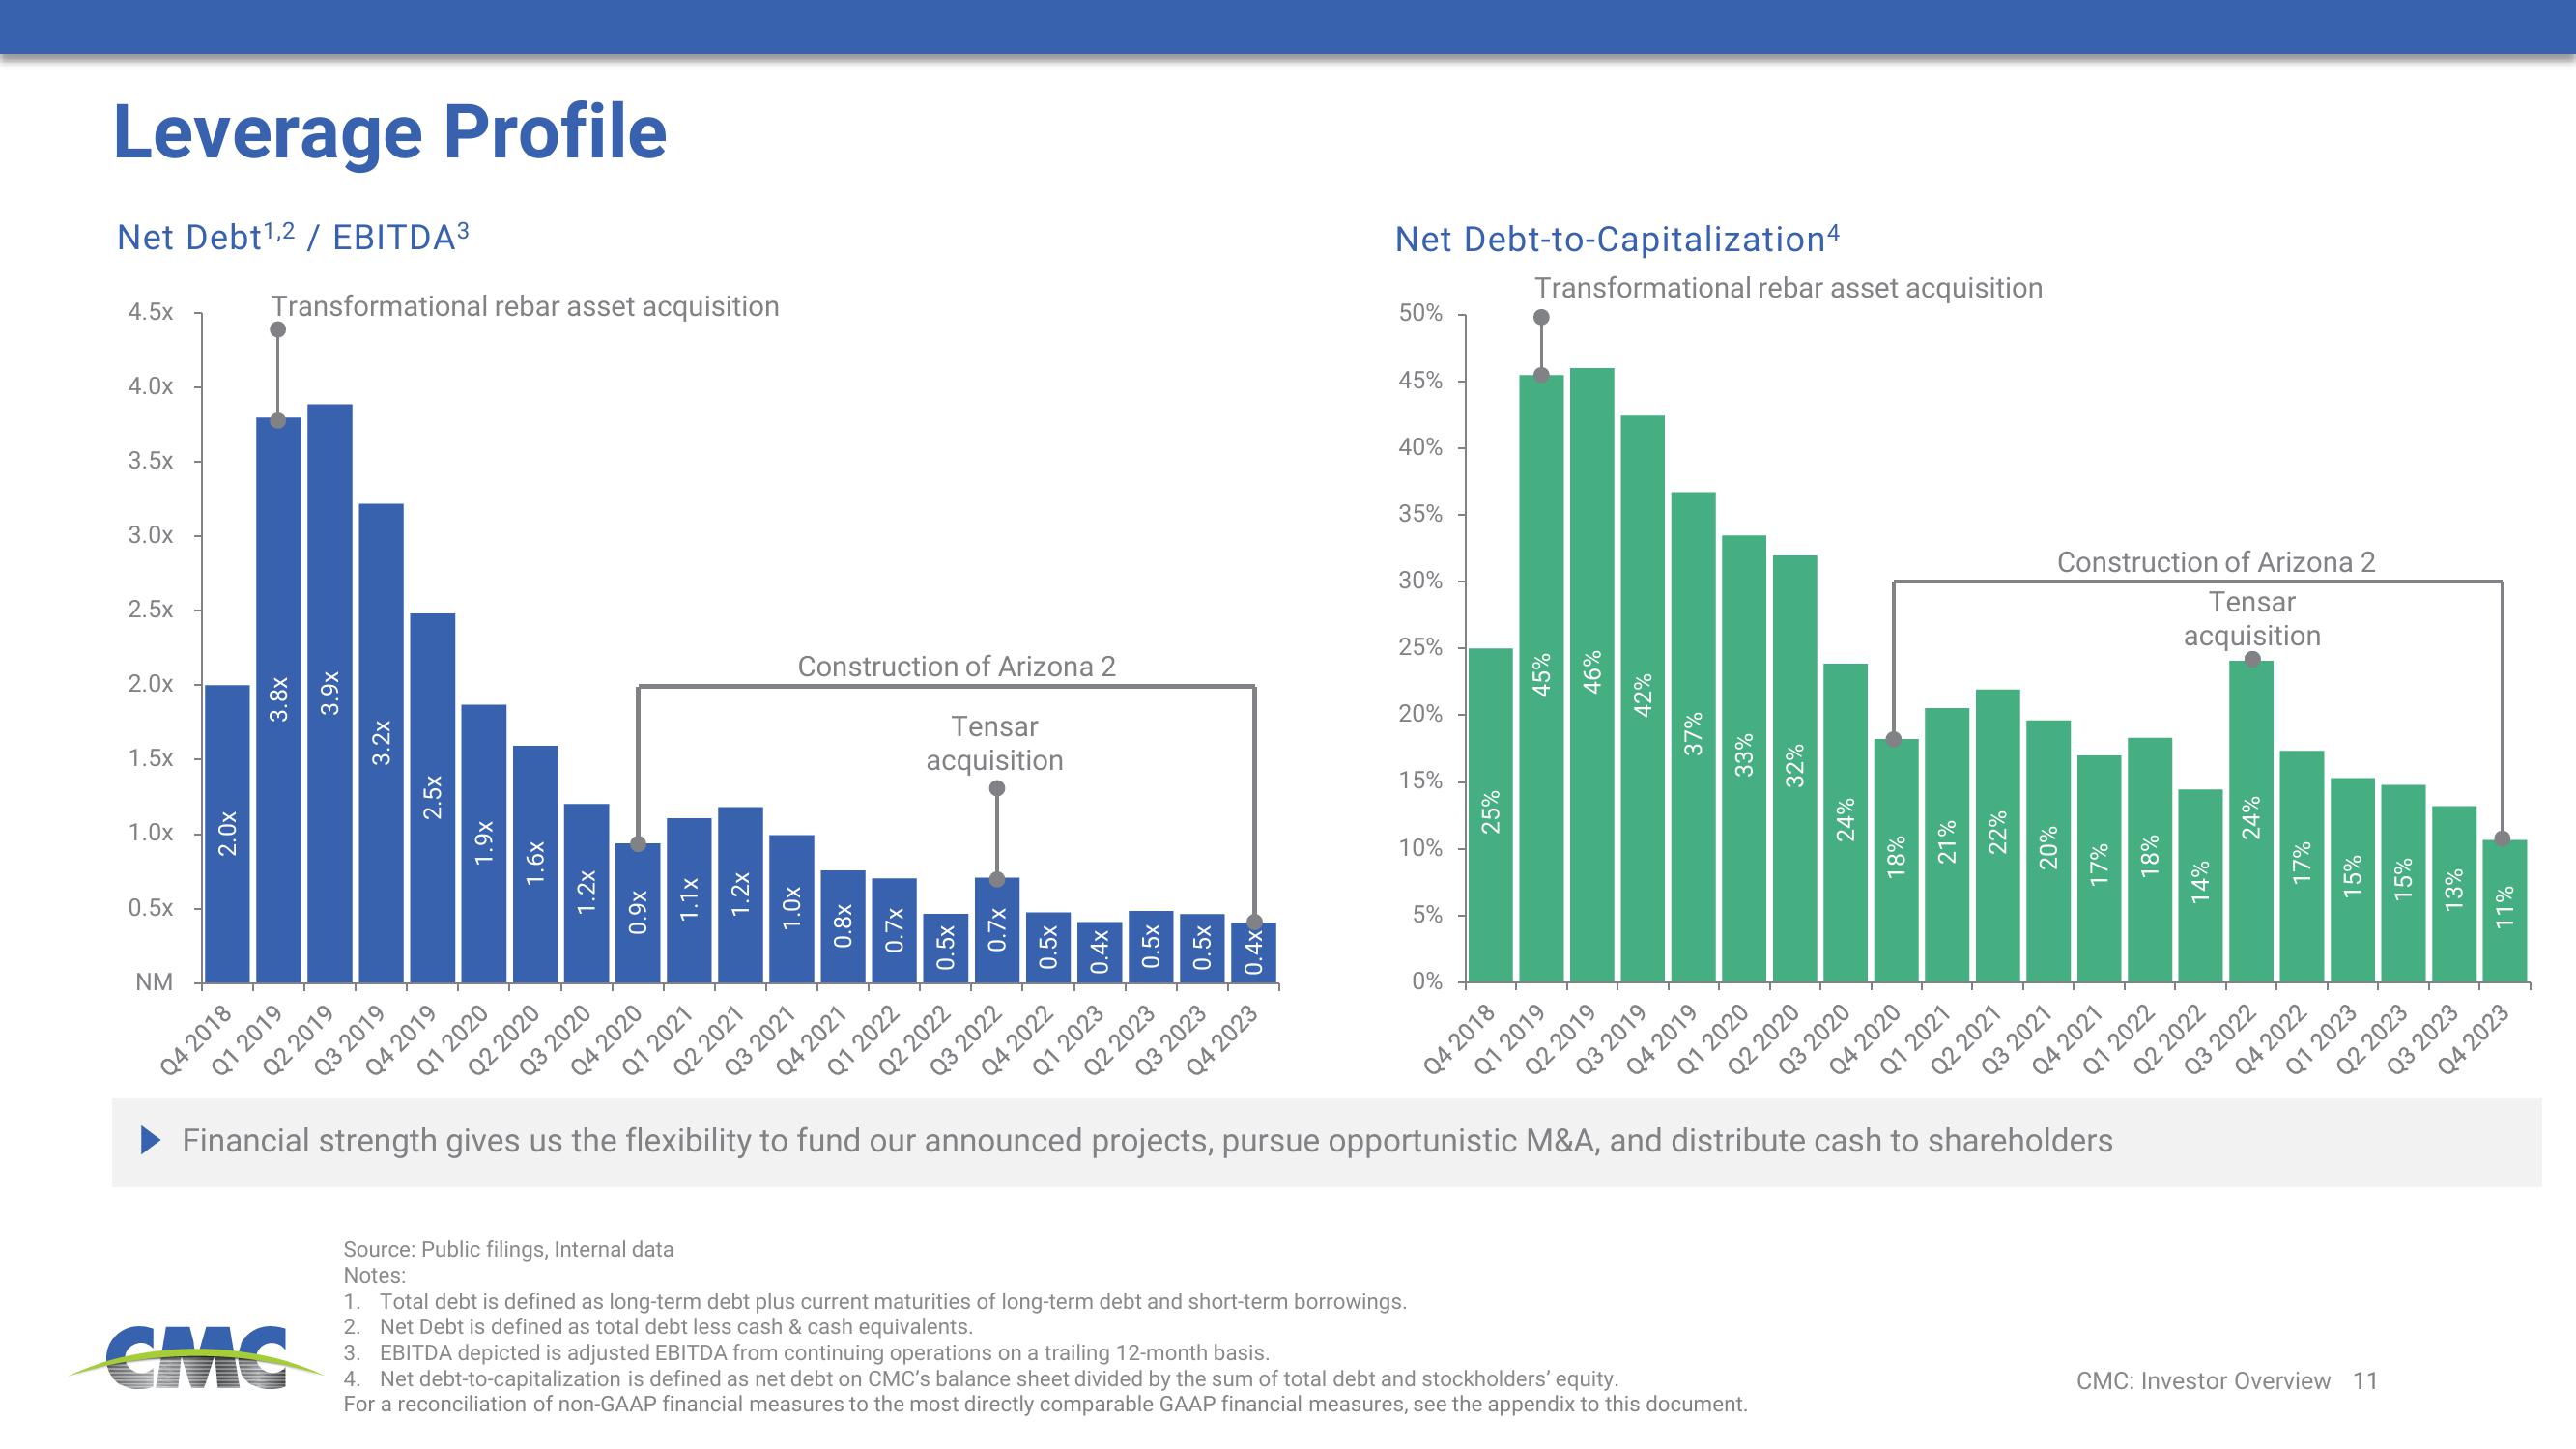
Leverage Profile
Net Debt¹,2 / EBITDA³
4.5x
4.0x
3.5x
3.0x
2.5x
2.0x
1.5x
1.0x
0.5x
NM
2.0x
Q4 2018
Transformational rebar asset acquisition
3.8x
Q1 2019
3.9x
CMC
Q2 2019
3.2x
2.5x
Q3 2019
Q4 2019
X6 L
Q1 2020
1.6x
Q2 2020
1.2x
Q3 2020
0.9x
Q4 2020
1.1x
Source: Public filings, Internal data
Notes:
Q1 2021
1.2x
Q2 2021
Construction of Arizona 2
Tensar
acquisition
1.0x
Q3 2021
0.8x
0.7x
0.5x
0.7x
0.5x
0.4x
Q4 2021
Q1 2022
Q2 2022
Q3 2022
Q4 2022
01 2023
Q2 2023
Q3 2023
Q4 2023
Net Debt-to-Capitalization4
50%
45%
40%
35%
30%
25%
20%
15%
10%
5%
1. Total debt is defined as long-term debt plus current maturities of long-term debt and short-term borrowings.
2. Net Debt is defined as total debt less cash & cash equivalents.
0%
25%
Q4 2018
Transformational rebar asset acquisition
45%
46%
Q1 2019
Q2 2019
42%
Q3 2019
37%
Q4 2019
33%
Q1 2020
32%
3. EBITDA depicted is adjusted EBITDA from continuing operations on a trailing 12-month basis.
4. Net debt-to-capitalization is defined as net debt on CMC's balance sheet divided by the sum of total debt and stockholders' equity.
For a reconciliation of non-GAAP financial measures to the most directly comparable GAAP financial measures, see the appendix to this document.
Q2 2020
24%
Q3 2020
18%
Q4 2020
Q1 2021
Q2 2021
Financial strength gives us the flexibility to fund our announced projects, pursue opportunistic M&A, and distribute cash to shareholders
Construction of Arizona 2
Tensar
acquisition
04 2021
Q3 2021
Q1 2022
14%
Q2 2022
24%
Q3 2022
17%
04 2022
Q1 2023
CMC: Investor Overview 11
02 2023
03 2023
Q4 2023View entire presentation