Confluent Investor Presentation Deck
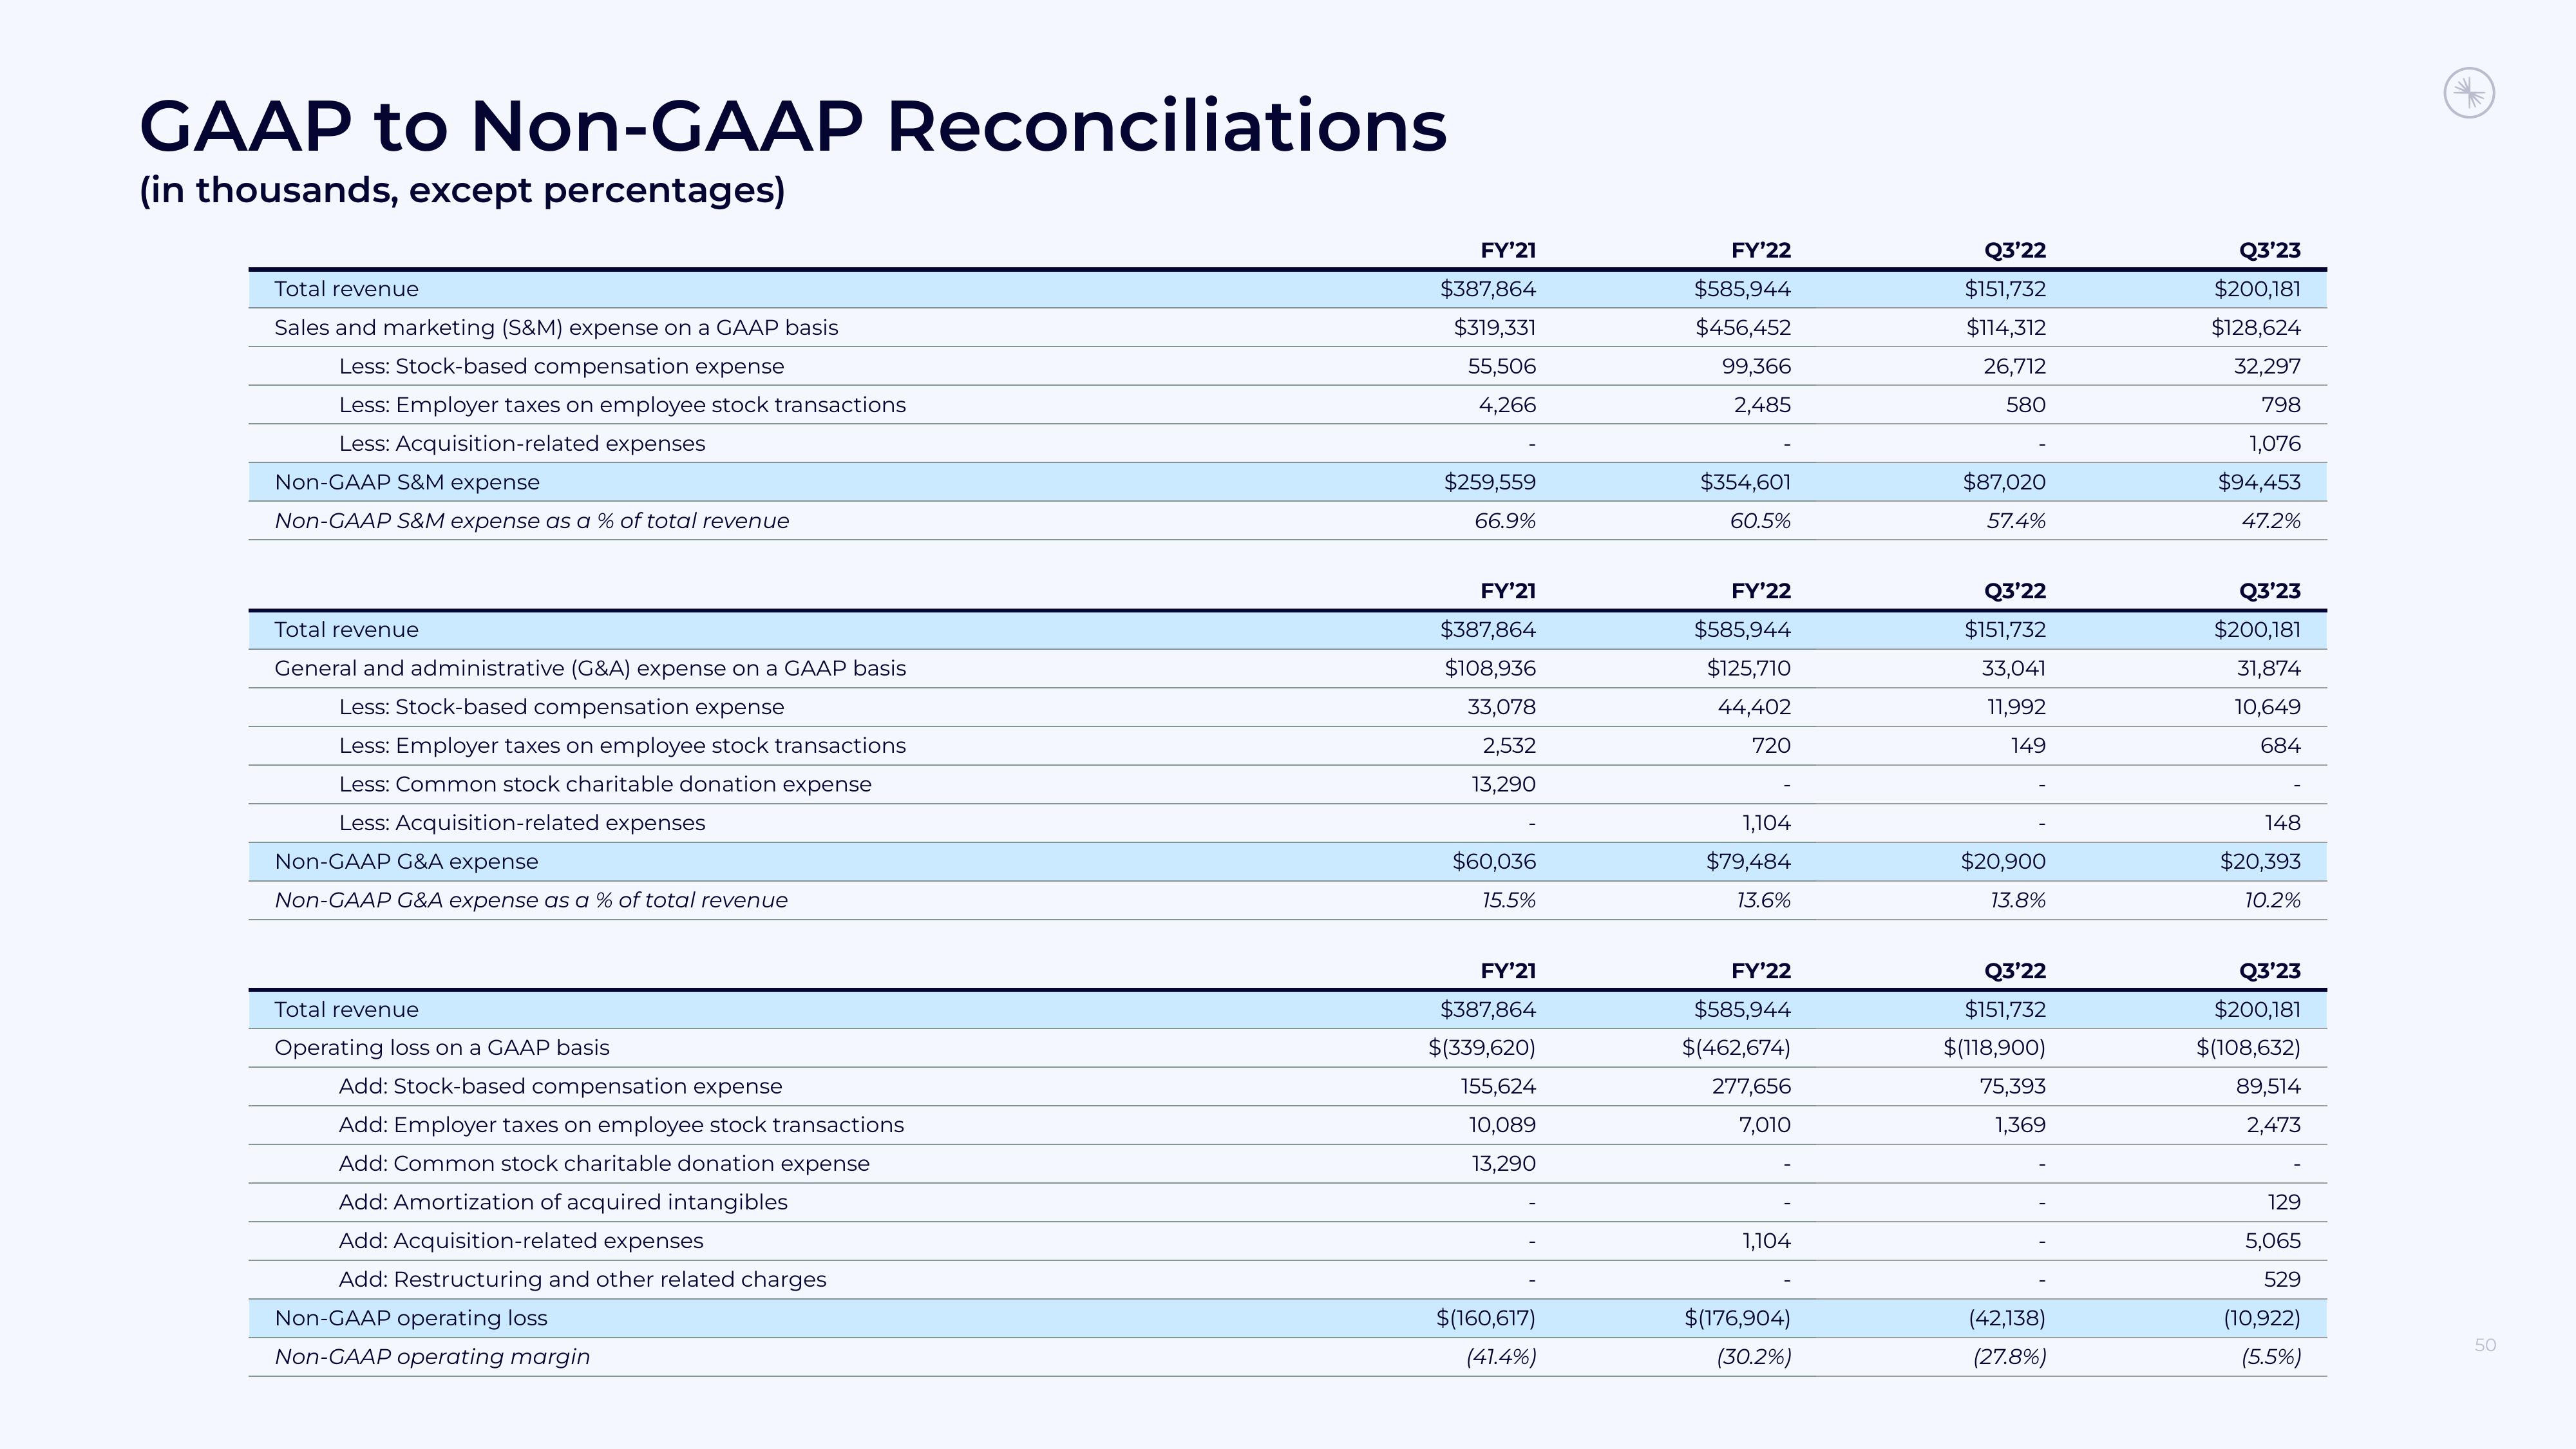
GAAP to Non-GAAP Reconciliations
(in thousands, except percentages)
Total revenue
Sales and marketing (S&M) expense on a GAAP basis
Less: Stock-based compensation expense
Less: Employer taxes on employee stock transactions
Less: Acquisition-related expenses
Non-GAAP S&M expense
Non-GAAP S&M expense as a % of total revenue
Total revenue
General and administrative (G&A) expense on a GAAP basis
Less: Stock-based compensation expense
Less: Employer taxes on employee stock transactions
Less: Common stock charitable donation expense
Less: Acquisition-related expenses
Non-GAAP G&A expense
Non-GAAP G&A expense as a % of total revenue
Total revenue
Operating loss on a GAAP basis.
Add: Stock-based compensation expense
Add:
taxes employee stock transactions
Add: Common stock charitable donation expense
Add: Amortization of acquired intangibles
Add: Acquisition-related expenses
Add: Restructuring and other related charges
Non-GAAP operating loss
Non-GAAP operating margin
FY'21
$387,864
$319,331
55,506
4,266
$259,559
66.9%
FY'21
$387,864
$108,936
33,078
2,532
13,290
$60,036
15.5%
FY'21
$387,864
$(339,620)
155,624
10,089
13,290
$(160,617)
(41.4%)
FY'22
$585,944
$456,452
99,366
2,485
$354,601
60.5%
FY'22
$585,944
$125,710
44,402
720
1,104
$79,484
13.6%
FY'22
$585,944
$(462,674)
277,656
7,010
1,104
$(176,904)
(30.2%)
Q3'22
$151,732
$114,312
26,712
580
$87,020
57.4%
Q3'22
$151,732
33,041
11,992
149
$20,900
13.8%
Q3'22
$151,732
$(118,900)
75,393
1,369
(42,138)
(27.8%)
Q3'23
$200,181
$128,624
32,297
798
1,076
$94,453
47.2%
Q3'23
$200,181
31,874
10,649
684
148
$20,393
10.2%
Q3'23
$200,181
$(108,632)
89,514
2,47
129
5,065
529
(10,922)
(5.5%)
50View entire presentation