Babylon Investor Day Presentation Deck
Scale is the Key to Profitability
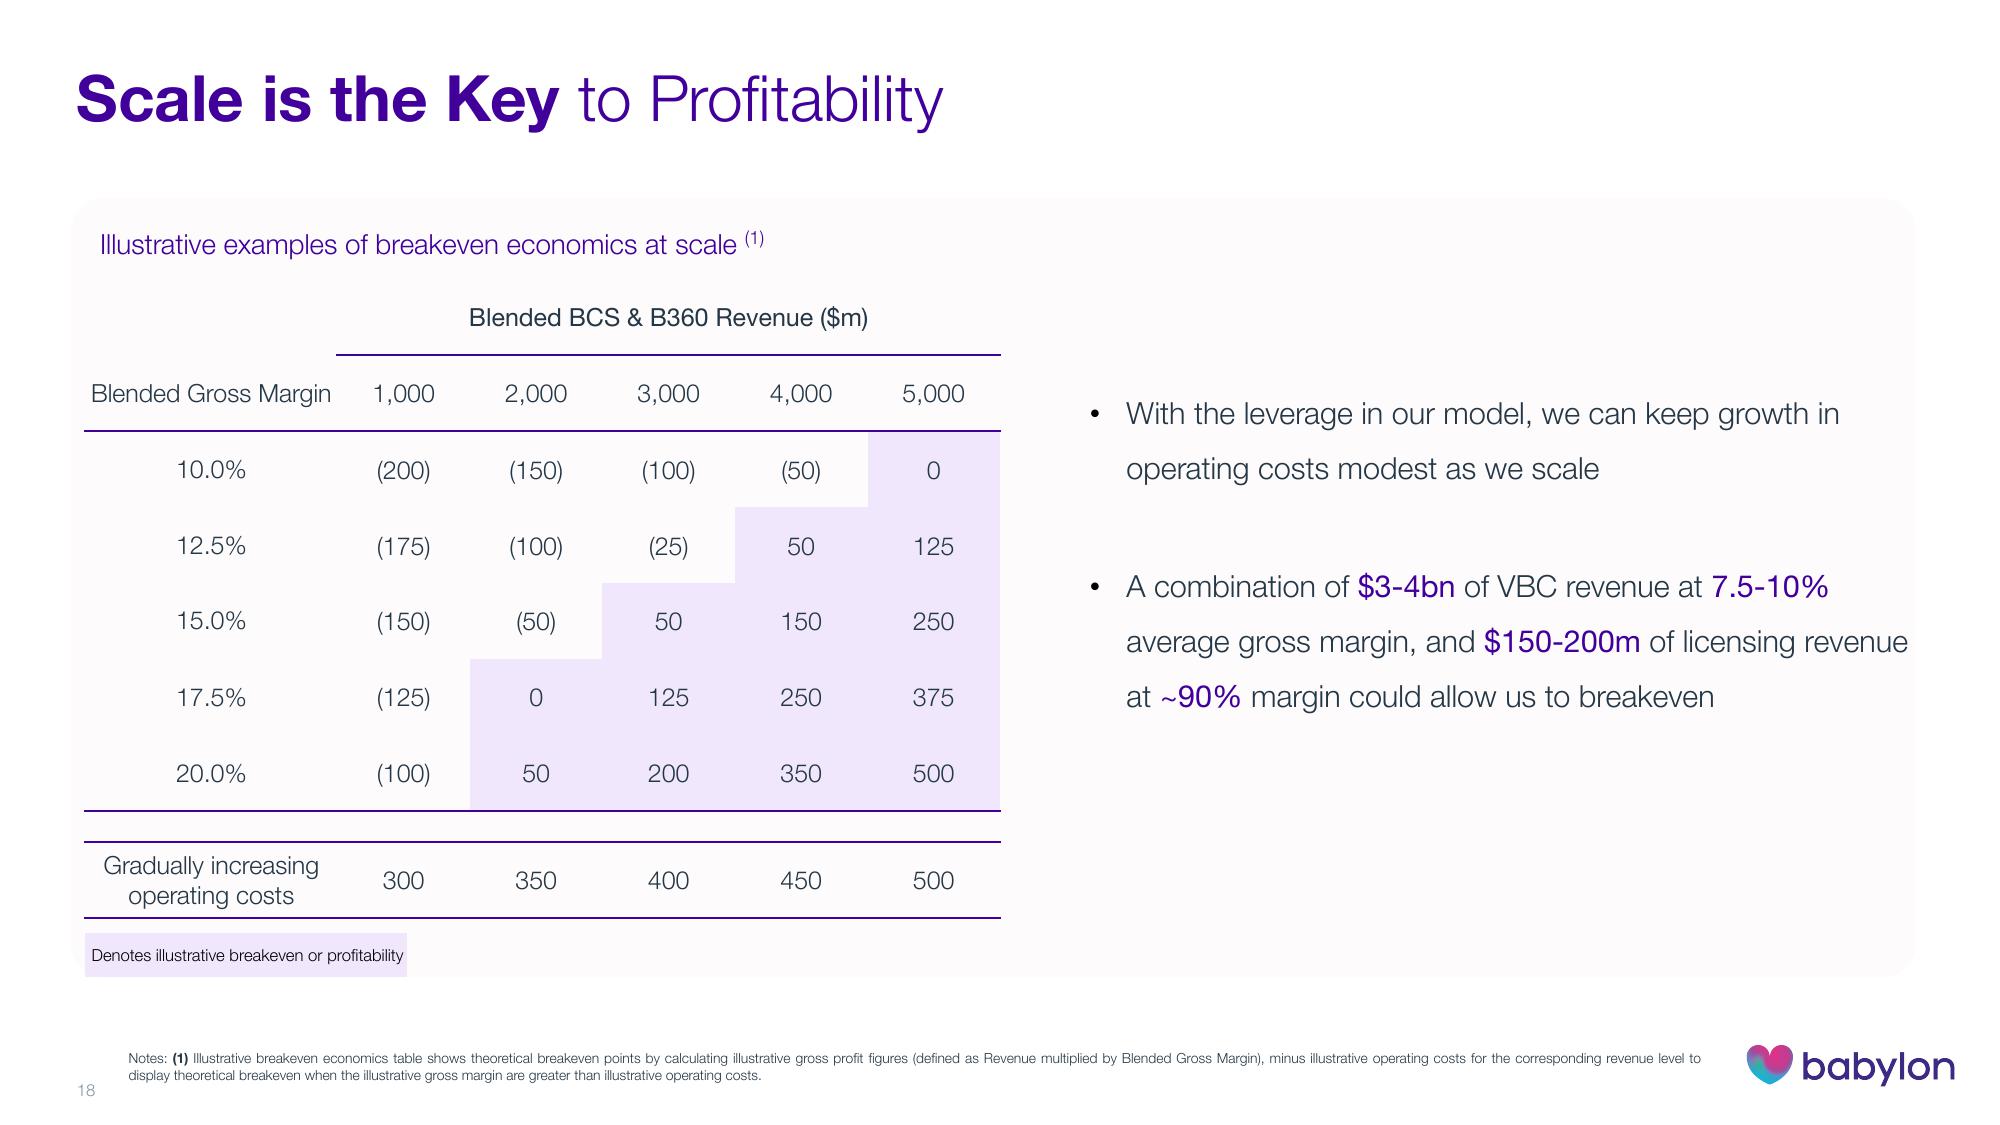
Illustrative examples of breakeven economics at scale (1)
Blended Gross Margin 1,000
18
10.0%
12.5%
15.0%
17.5%
20.0%
Gradually increasing
operating costs
(200)
(175)
(150)
(125)
(100)
300
Denotes illustrative breakeven or profitability
Blended BCS & B360 Revenue ($m)
2,000
(150)
(100)
(50)
0
50
350
3,000
(100)
(25)
50
125
200
400
4,000
(50)
50
150
250
350
450
5,000
0
125
250
375
500
500
●
●
With the leverage in our model, we can keep growth in
operating costs modest as we scale
A combination of $3-4bn of VBC revenue at 7.5-10%
average gross margin, and $150-200m of licensing revenue
at ~90% margin could allow us to breakeven
Notes: (1) Illustrative breakeven economics table shows theoretical breakeven points by calculating illustrative gross profit figures (defined as Revenue multiplied by Blended Gross Margin), minus illustrative operating costs for the corresponding revenue level to
display theoretical breakeven when the illustrative gross margin are greater than illustrative operating costs.
babylonView entire presentation