Investor Presentation
Installed Generation Capacity
(GW)
ENERGY & CLIMATE TECHNOLOGIES: SECTOR OVERVIEW
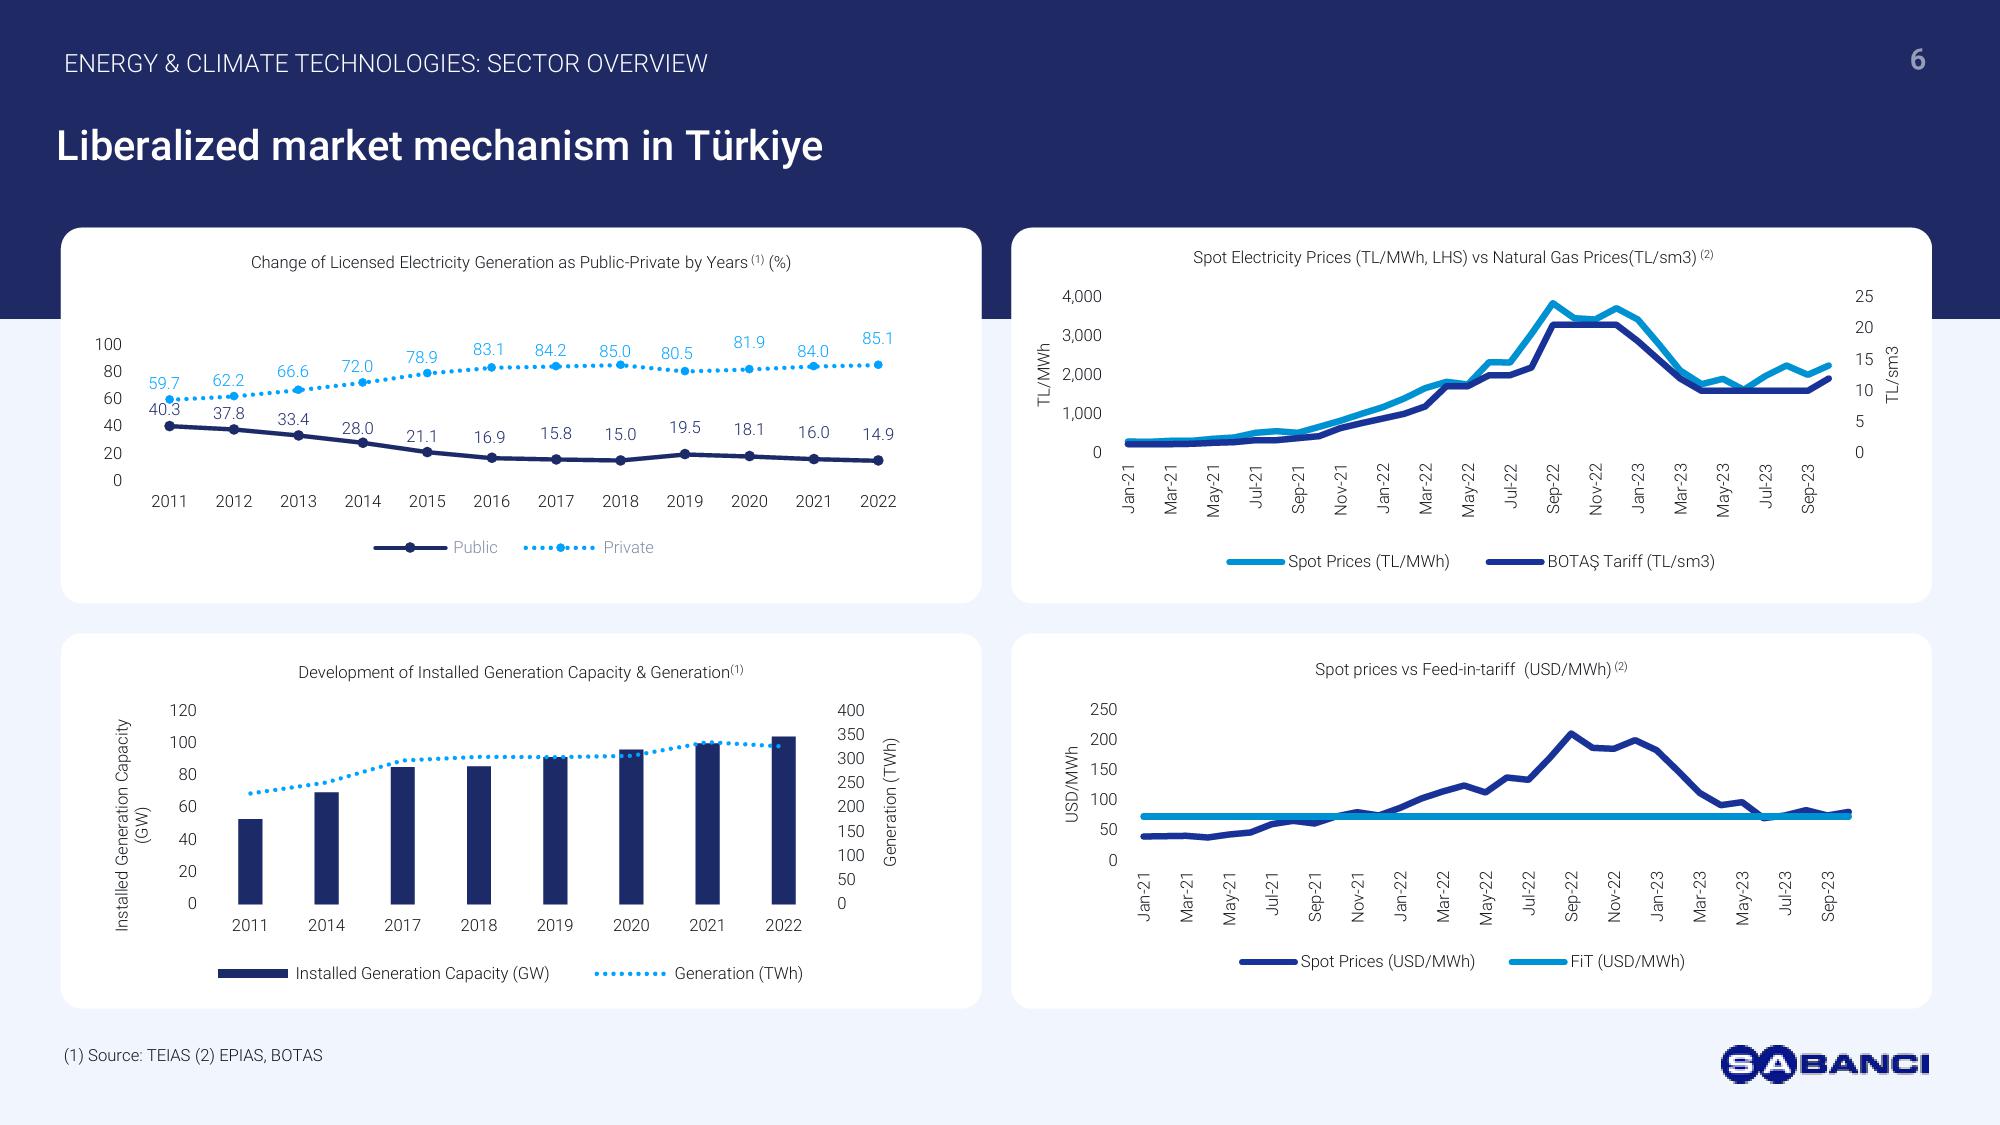
Liberalized market mechanism in Türkiye
Change of Licensed Electricity Generation as Public-Private by Years (1) (%)
100
78.9
83.1 84.2 85.0
81.9
85.1
80.5
84.0
80
66.6 72.0
59.7
62.2
60
40.3 37.8
33.41
40
28.0
19.5
21.1
16.9
15.8 15.0
18.1
16.0
14.9
20
0
2011 2012 2013
2014 2015 2016
2017
2018 2019 2020
2021 2022
Public
Private
120
80
60
40
20
༆ ཎྜ ྂ ¥ ཊཿ ॰
100
(1) Source: TEIAS (2) EPIAS, BOTAS
Development of Installed Generation Capacity & Generation(1)
100
50
0
2011
2014
2017
2018
2019
2020 2021
2022
Installed Generation Capacity (GW) ........ Generation (TWh)
400
350
300
250
200
150
Generation (TWh)
USD/MWh
250
200
150
100
50
Jan-21
Mar-21
May-21
Jul-21
TL/MWh
4,000
3,000
2,000
1,000
Spot Electricity Prices (TL/MWh, LHS) vs Natural Gas Prices(TL/sm3) (2)
Jan-21
Mar-21
May-21
Jul-21
Sep-21
Nov-21
Jan-22
Mar-22
Spot Prices (TL/MWh)
May-22
Jul-22
Sep-22
Nov-22
Jan-23
Mar-23
May-23
Jul-23
BOTAŞ Tariff (TL/sm3)
Spot prices vs Feed-in-tariff (USD/MWh) (2)
Sep-21
Nov-21
Jan-22
Mar-22
May-22
Jul-22
Sep-22
Nov-22
Jan-23
Spot Prices (USD/MWh)
FIT (USD/MWh)
Mar-23
May-23
Jul-23
Sep-23
SABANCI
Sep-23
15
10
225050
TL/sm3
6View entire presentation