Bank of America Investment Banking Pitch Book
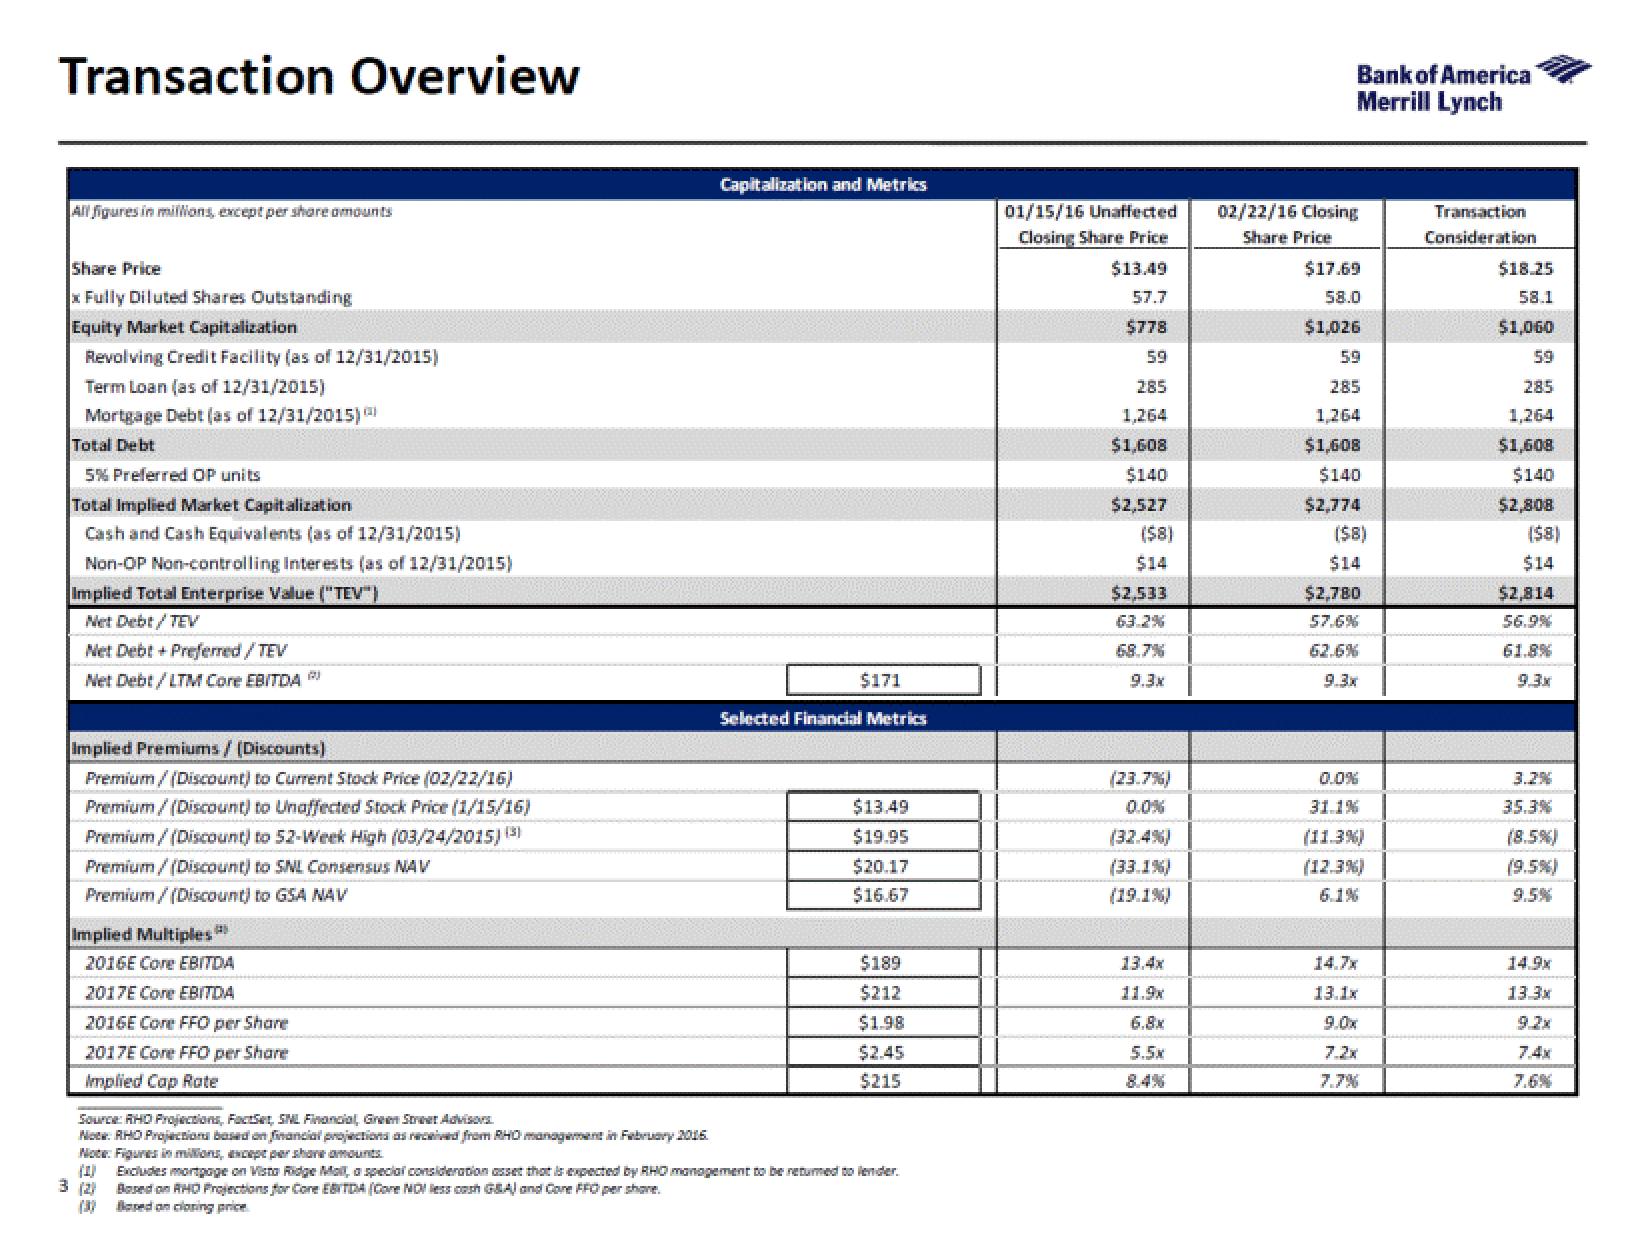
Transaction Overview
All figures in millions, except per share amounts
Share Price
x Fully Diluted Shares Outstanding
Equity Market Capitalization
Revolving Credit Facility (as of 12/31/2015)
Term Loan (as of 12/31/2015)
Mortgage Debt (as of 12/31/2015)
Total Debt
5% Preferred OP units
Total Implied Market Capitalization
Cash and Cash Equivalents (as of 12/31/2015)
Non-OP Non-controlling Interests (as of 12/31/2015)
Implied Total Enterprise Value ("TEV")
Net Debt/ TEV
Net Debt + Preferred / TEV
Net Debt/LTM Core EBITDA
Implied Premiums / (Discounts)
Premium/(Discount) to Current Stock Price (02/22/16)
Premium/(Discount) to Unaffected Stock Price (1/15/16)
Premium/(Discount) to 52-Week High (03/24/2015) (3)
Premium/(Discount) to SNL Consensus NAV
Premium/(Discount) to GSA NAV
Implied Multiples
2016E Core EBITDA
2017E Core EBITDA
2016E Core FFO per Share
2017E Core FFO per Share
Implied Cap Rate
Capitalization and Metrics
(1)
3 (2)
$171
Selected Financial Metrics
$13.49
$19.95
$20.17
$16.67
$189
$212
$1.98
$2.45
$215
Source: RHO Projections, FactSet, SNL Financial, Green Street Advisors.
Note: RHO Projections based on financial projections as received from RHO management in February 2016
Note: Figures in millions, except per share amounts
Excludes mortgage on Visto Ridge Mall, a special consideration asset that is expected by RHO management to be returned to lender.
Based on RHD Projections for Core EBITDA (Core NO! less cash GEA) and Care FFO per share.
Based on closing price
01/15/16 Unaffected
Closing Share Price
$13.49
57.7
$778
59
285
1,264
$1,608
$140
$2,527
($8)
$14
$2,533
9.3x
(23.7%)
0.0%
(32.4%)
(33.1%)
(19.1%)
13.4x
6.8x
5.5x
Bank of America
Merrill Lynch
02/22/16 Closing
Share Price
$17.69
58.0
$1,026
59
285
1,264
$1,608
$140
$2,774
($8)
$14
$2,780
57.6%
62.6%
9.3x
0.0%
31.1%
(11.3%)
(12.3%)
13.1x
9.0x
7.7%
Transaction
Consideration
$18.25
58.1
$1,060
59
285
1,264
$1,608
$140
$2,808
($8)
$14
$2,814
56.9%
61.8%
9.3x
35.3%
(8.5%)
(9.5%)
9.5%
14.9x
13.3x
7.4xView entire presentation