Barclays Capital 2010 Global Financial Services Conference
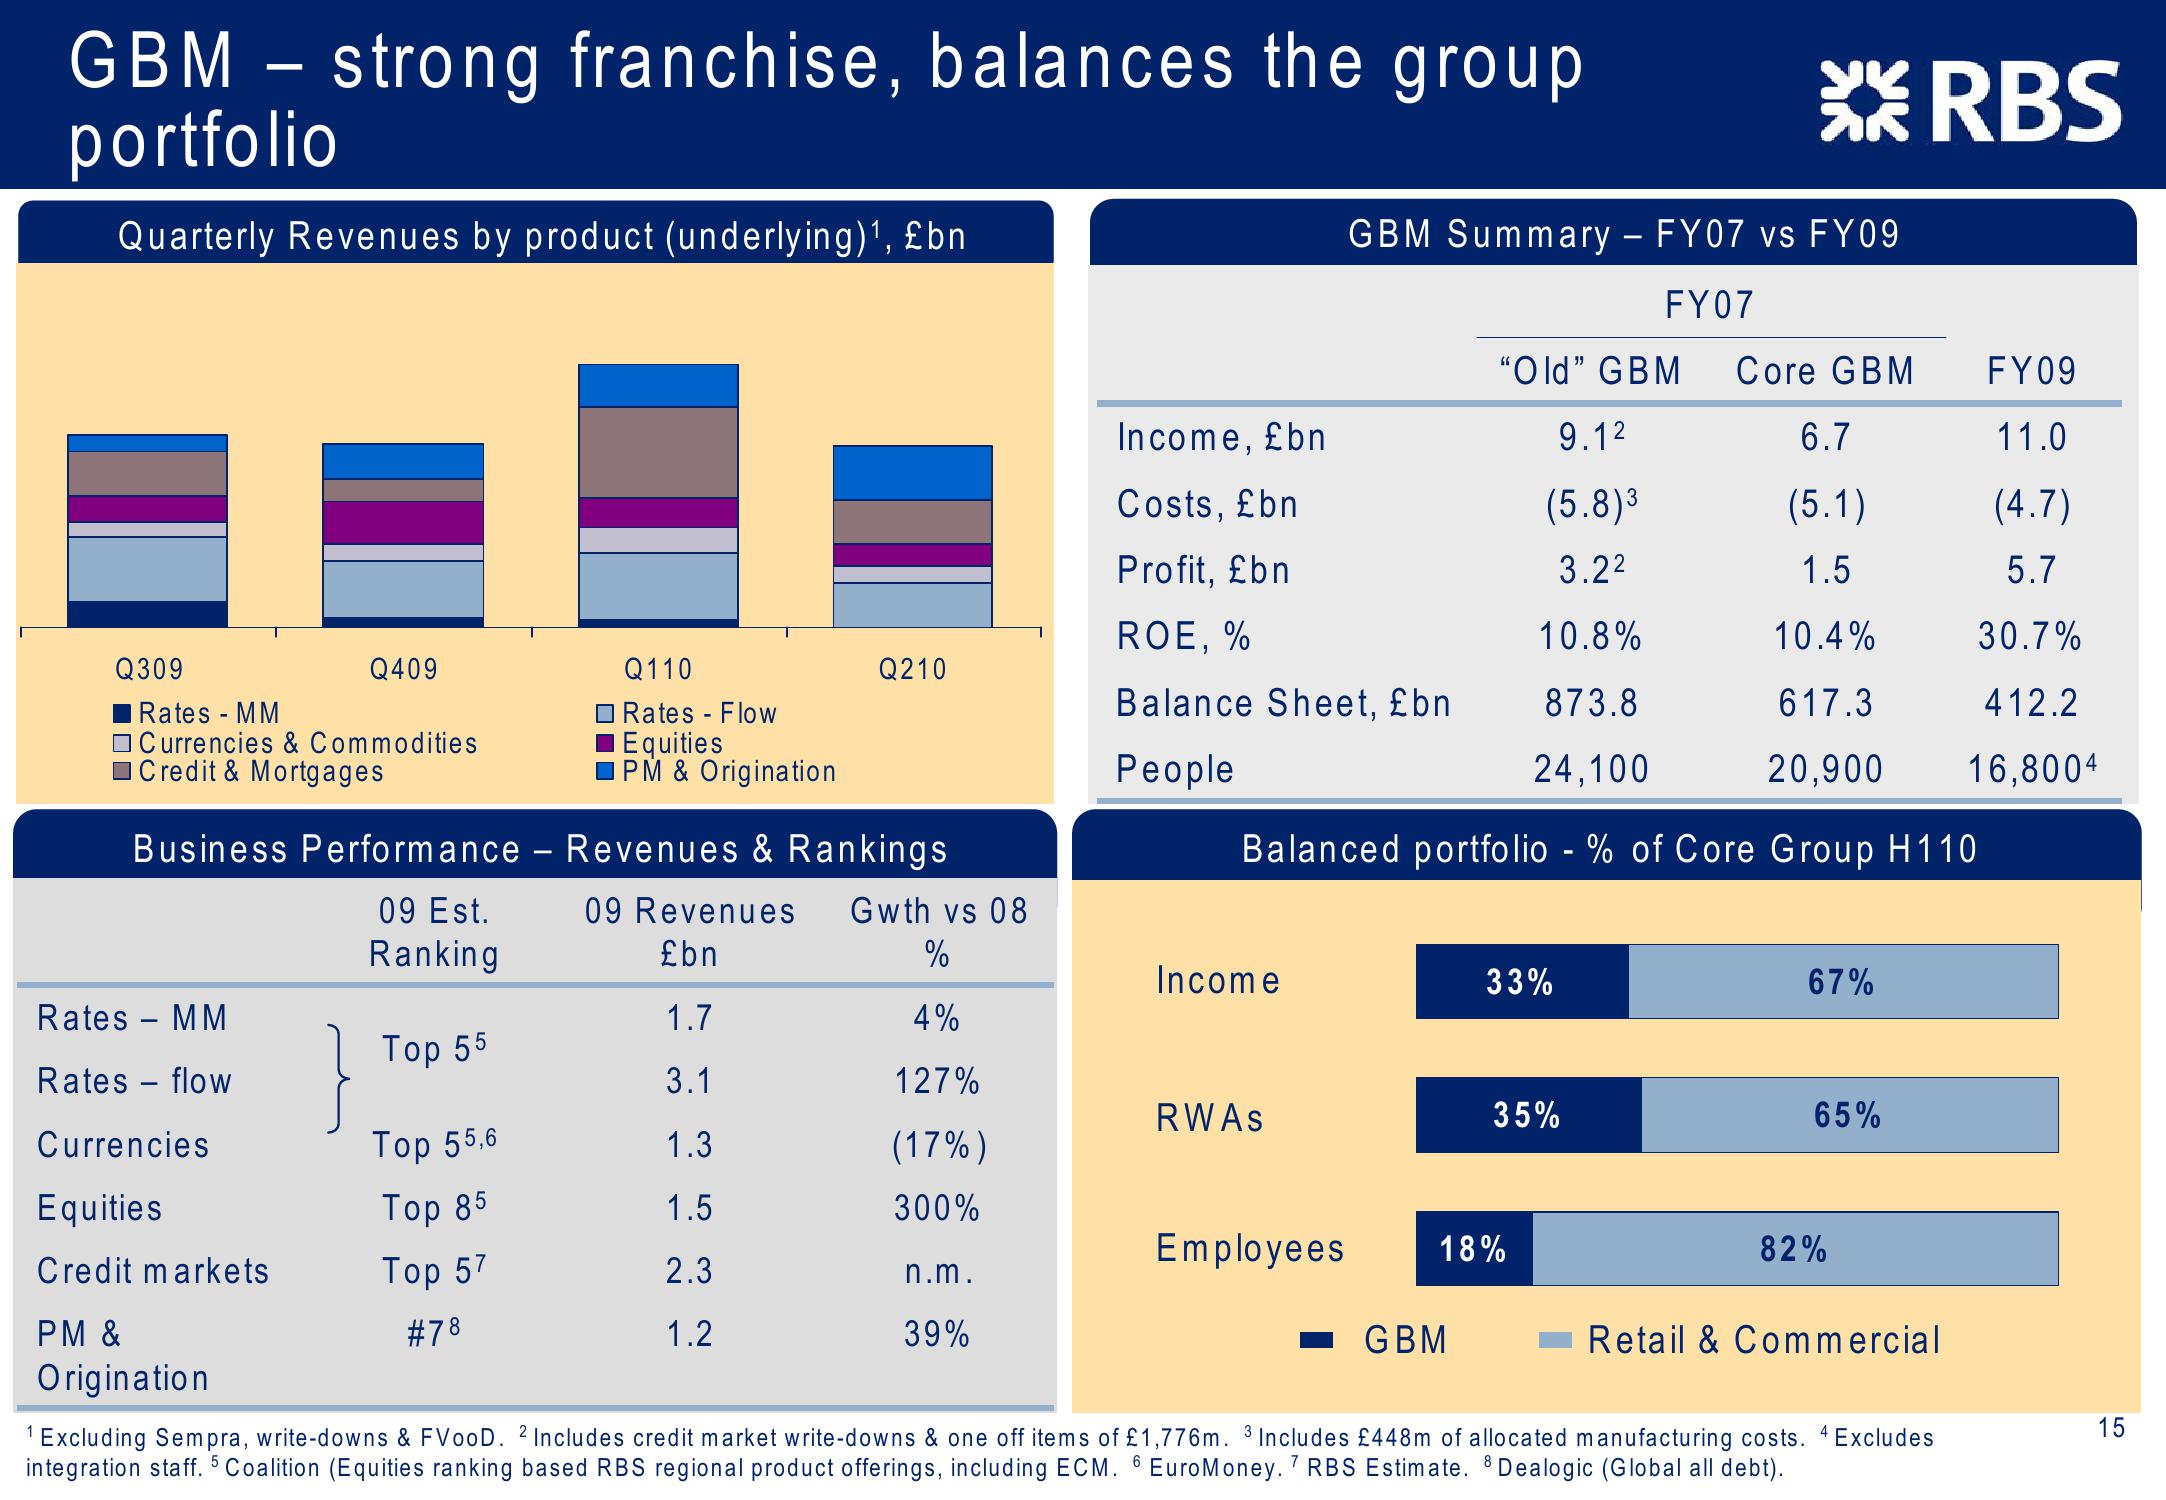
GBM - strong franchise, balances the group
portfolio
Quarterly Revenues by product (underlying)¹, £bn
GBM Summary - FY07 vs FY09
RBS
FY07
"Old" GBM
Core GBM
FY09
Income, £bn
9.12
6.7
11.0
Costs, £bn
(5.8)³
(5.1)
(4.7)
Profit, £bn
3.22
1.5
5.7
ROE, %
10.8%
10.4%
30.7%
Q309
Rates - MM
Q409
Q110
Q210
□ Rates - Flow
Balance Sheet, £bn
873.8
617.3
412.2
Currencies & Commodities
Equities
Credit & Mortgages
IPM & Origination
People
24,100
20,900
16,8004
Business Performance
-
Revenues & Rankings
Balanced portfolio - % of Core Group H110
09 Est.
09 Revenues
Gwth vs 08
Ranking
£bn
%
Income
33%
67%
Rates - MM
1.7
4%
Top 55
Rates - flow
3.1
127%
RWAs
35%
65%
Currencies
Top 55,6
1.3
(17%)
Equities
Top 85
1.5
300%
Credit markets
Top 57
Employees
18%
82%
2.3
n.m.
PM &
#78
1.2
39%
GBM
Retail & Commercial
Origination
1 Excluding Sempra, write-downs & FVooD. 2 Includes credit market write-downs & one off items of £1,776m. 3 Includes £448m of allocated manufacturing costs. 4 Excludes
integration staff. 5 Coalition (Equities ranking based RBS regional product offerings, including ECM. 6 EuroMoney. 7 RBS Estimate. 8 Dealogic (Global all debt).
15View entire presentation