Paysafe SPAC Presentation Deck
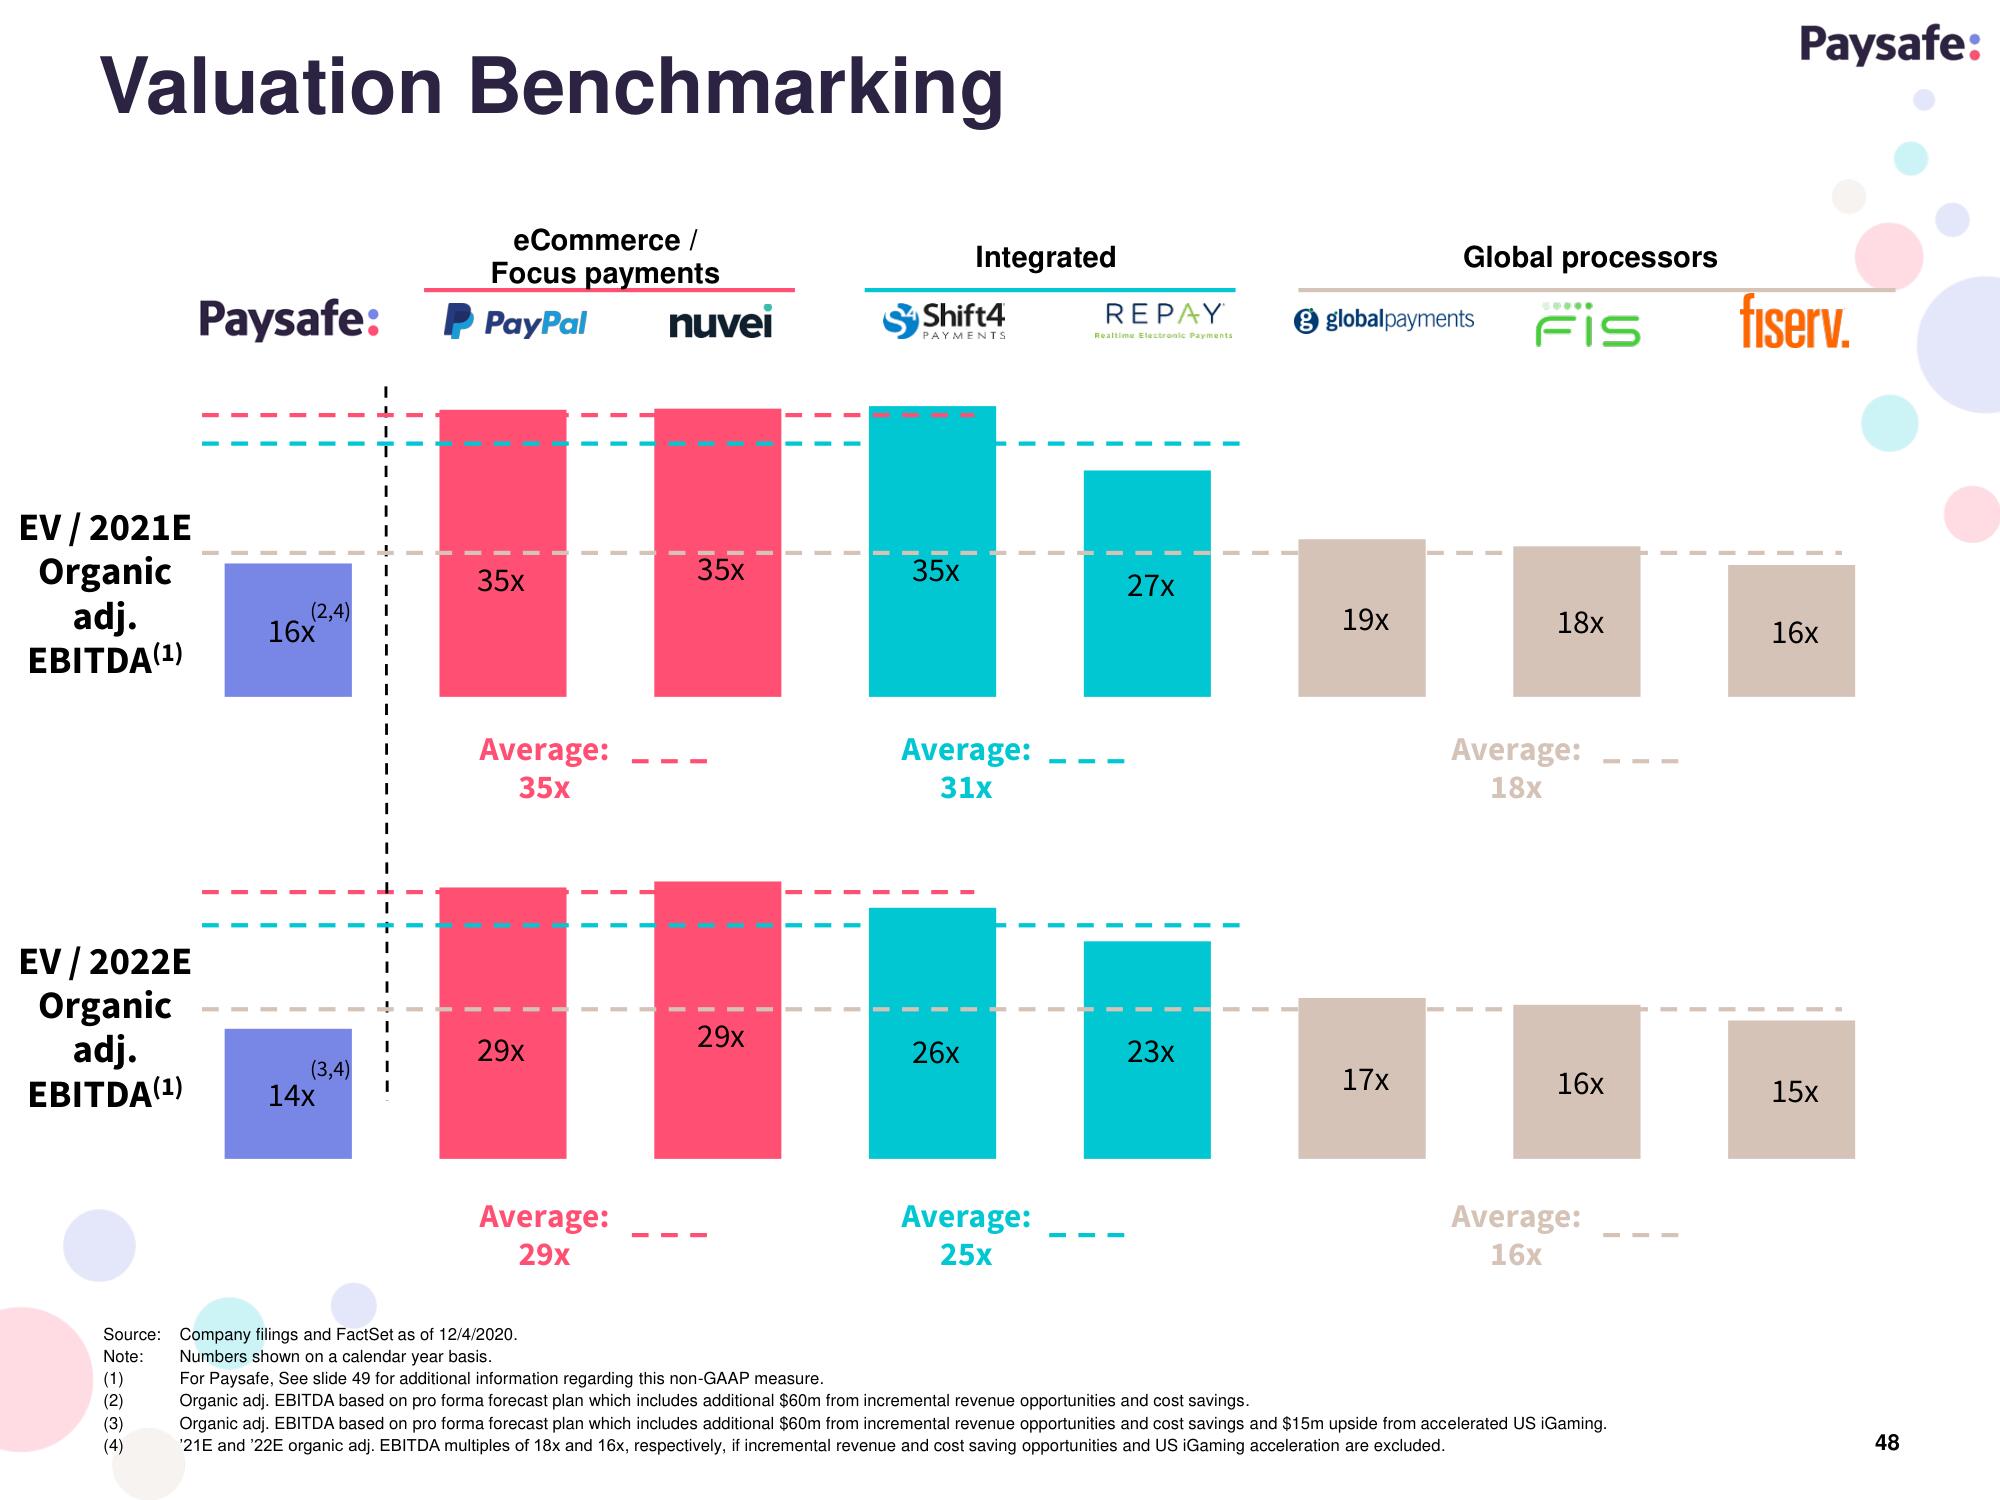
Valuation Benchmarking
eCommerce /
Focus payments
PayPal nuvei
EV / 2021E
Organic
adj.
EBITDA (¹)
EV/2022E
Organic
adj.
EBITDA(¹)
(1)
(2)
Paysafe:
(3)
(4)
(2,4)
16x
(3,4)
14x
1
I
I
I
J
I
I
I
I
I
I
I
I
I
T
I
I
35x
Average:
35x
29x
Average:
29x
35x
29x
II
Shift4
PAYMENTS
35x
Integrated
Average:
31x
26x
Average:
25x
REPAY
Realtime Electronic Payments
27x
23x
globalpayments
19x
Global processors
17x
FIS fiserv.
18x
Average:
18x
16x
Source: Company filings and FactSet as of 12/4/2020.
Note:
Numbers shown on a calendar year basis.
For Paysafe, See slide 49 for additional information regarding this non-GAAP measure.
Organic adj. EBITDA based on pro forma forecast plan which includes additional $60m from incremental revenue opportunities and cost savings.
Organic adj. EBITDA based on pro forma forecast plan which includes additional $60m from incremental revenue opportunities and cost savings and $15m upside from accelerated US iGaming.
'21E and '22E organic adj. EBITDA multiples of 18x and 16x, respectively, if incremental revenue and cost saving opportunities and US iGaming acceleration are excluded.
Average:
16x
Paysafe:
16x
15x
48View entire presentation