Shift SPAC Presentation Deck
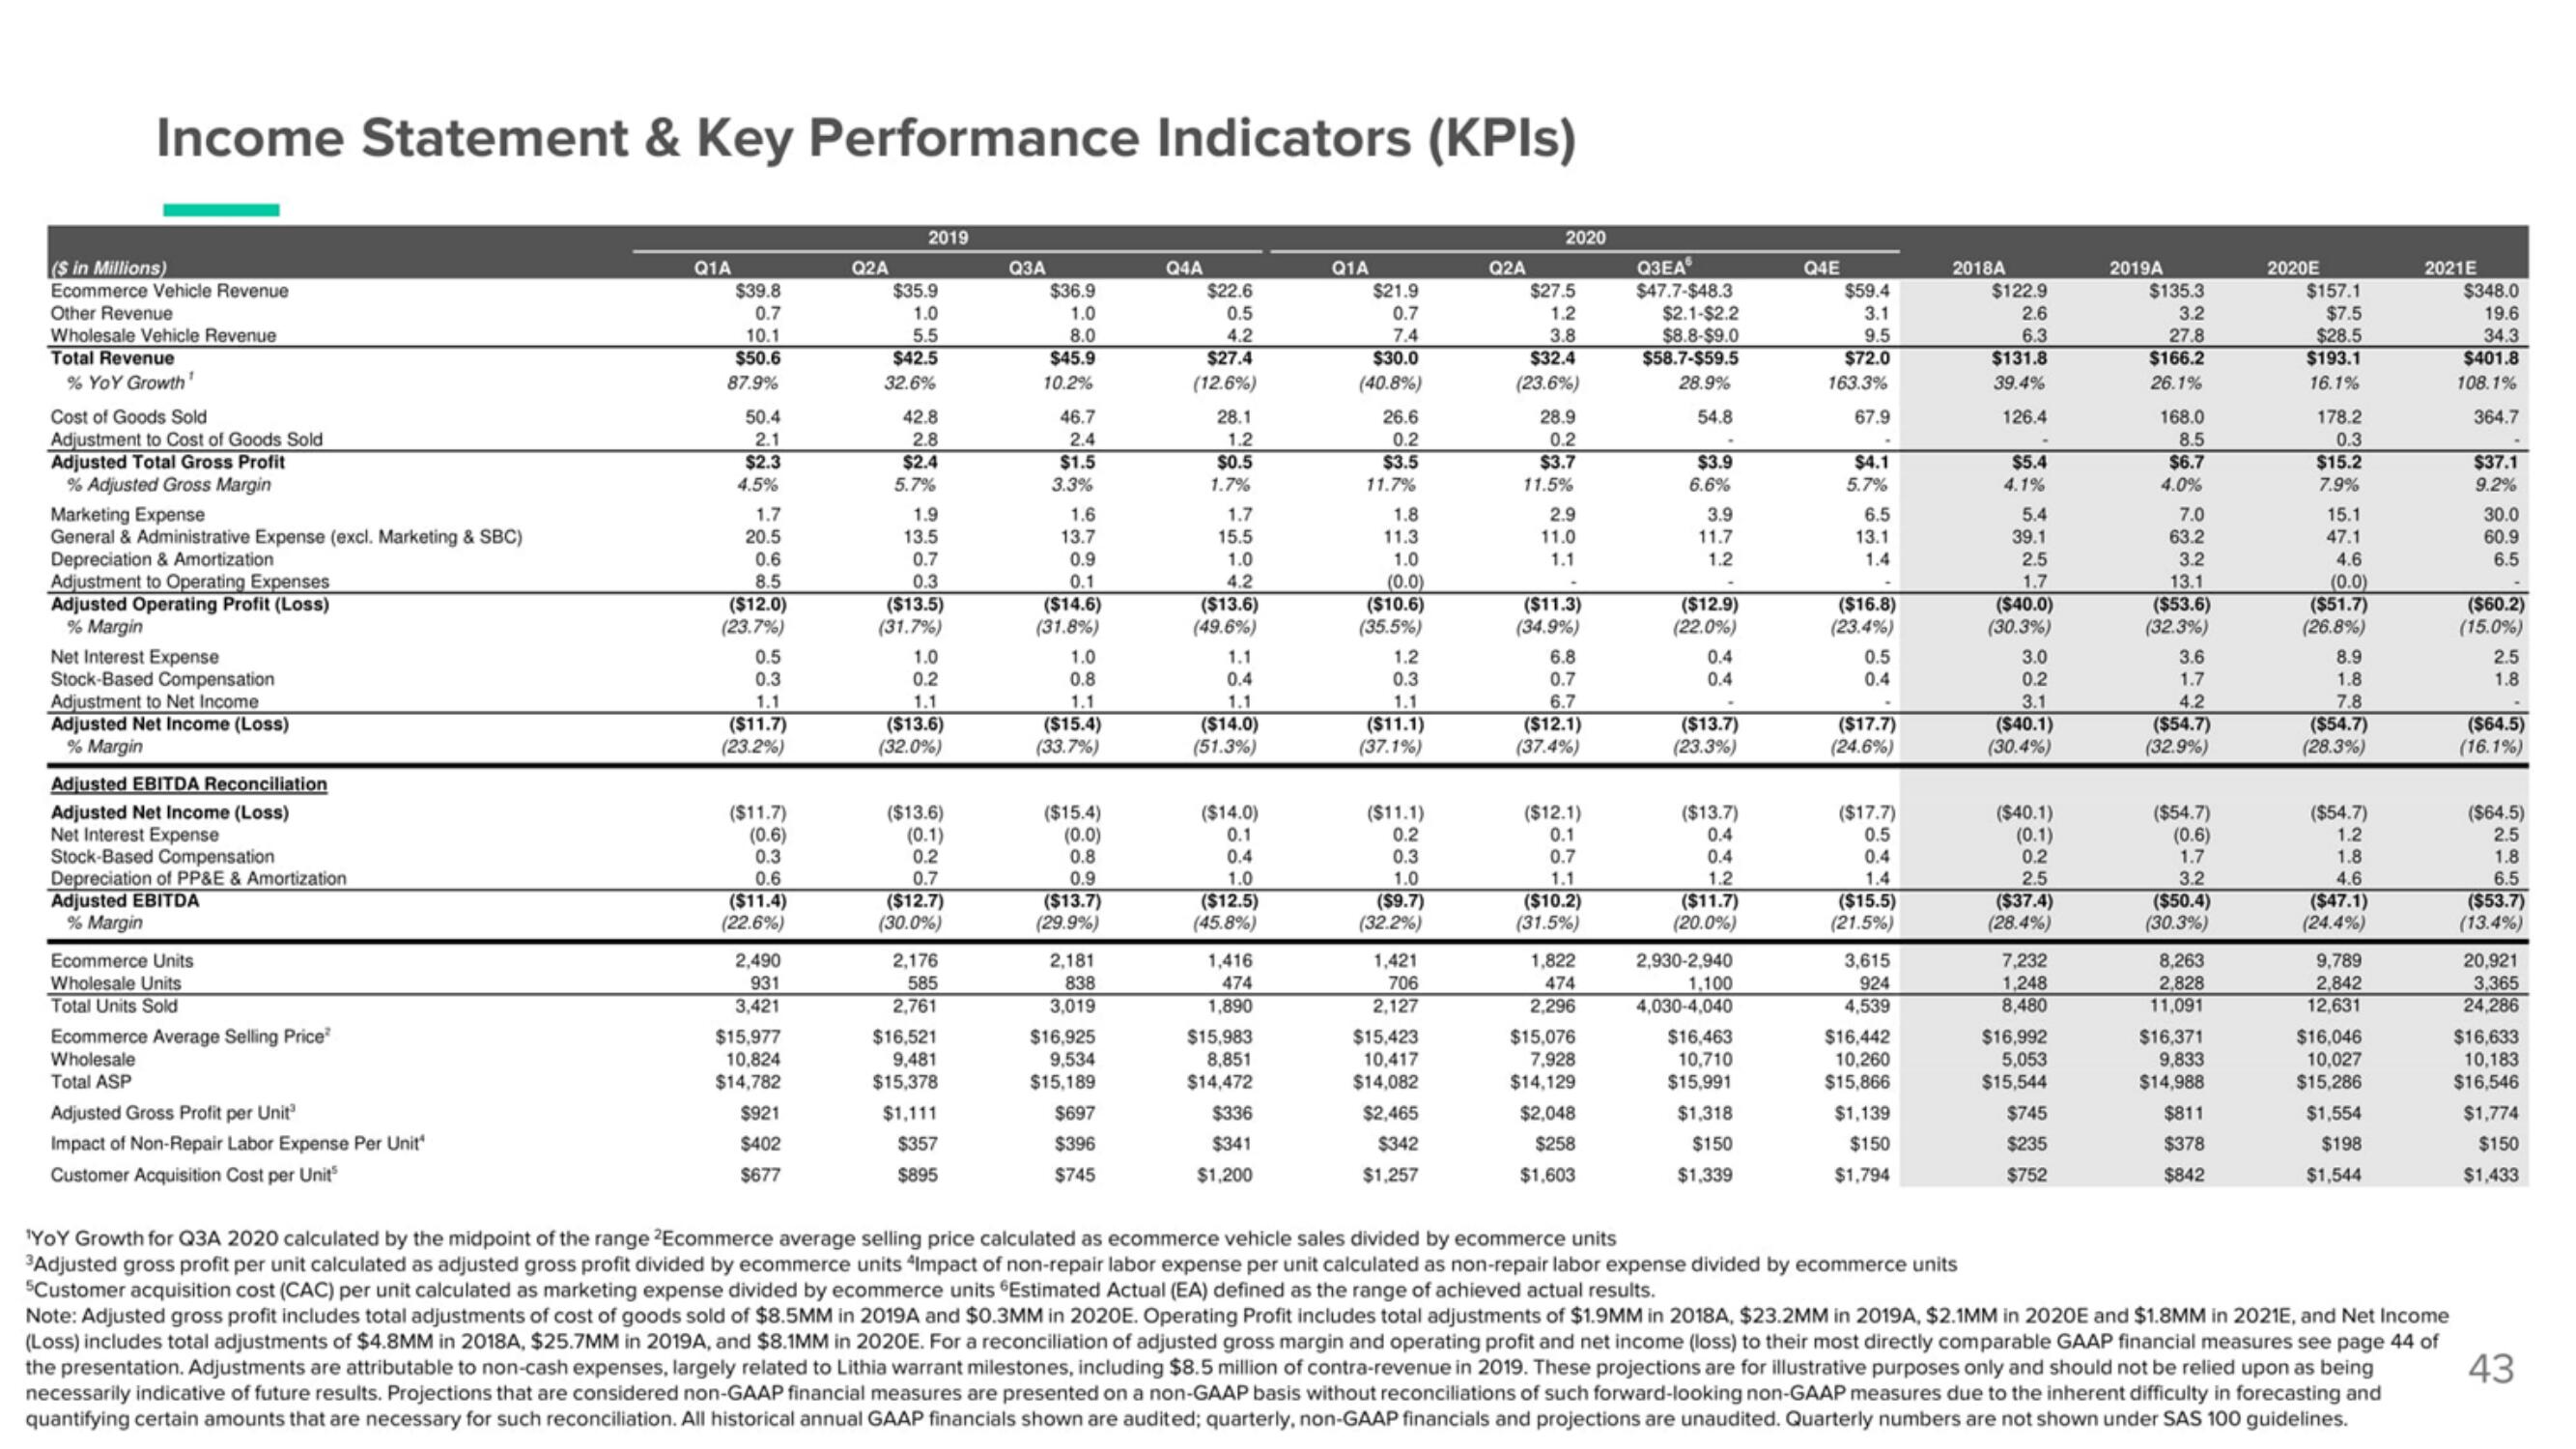
Income Statement & Key Performance Indicators (KPIs)
($ in Millions)
Ecommerce Vehicle Revenue
Other Revenue
Wholesale Vehicle Revenue
Total Revenue
% YoY Growth¹
Cost of Goods Sold
Adjustment to Cost of Goods Sold
Adjusted Total Gross Profit
% Adjusted Gross Margin
Marketing Expense
General & Administrative Expense (excl. Marketing & SBC)
Depreciation & Amortization
Adjustment to Operating Expenses
Adjusted Operating Profit (Loss)
% Margin
Net Interest Expense
Stock-Based Compensation
Adjustment to Net Income
Adjusted Net Income (Loss)
% Margin
Adjusted EBITDA Reconciliation
Adjusted Net Income (Loss)
Net Interest Expense
Stock-Based Compensation
Depreciation of PP&E & Amortization
Adjusted EBITDA
% Margin
Ecommerce Units
Wholesale Units
Total Units Sold
Ecommerce Average Selling Price
Wholesale
Total ASP
Adjusted Gross Profit per Unit
Impact of Non-Repair Labor Expense Per Unit
Customer Acquisition Cost per Unit
Q1A
$39.8
0.7
10.1
$50.6
87.9%
50.4
2.1
$2.3
4.5%
1.7
20.5
0.6
8.5
($12.0)
(23.7%)
0.5
0.3
1.1
($11.7)
(23.2%)
($11.7)
(0.6)
0.3
0.6
($11.4)
(22.6%)
2,490
931
3,421
$15,977
10,824
$14,782
$921
$402
$677
Q2A
2019
$35.9
1.0
5.5
$42.5
32.6%
42.8
2.8
$2.4
5.7%
1.9
13.5
0.7
0.3
($13.5)
(31.7%)
1.0
0.2
1.1
($13.6)
(32.0%)
($13.6)
(0.1)
0.2
0.7
($12.7)
(30.0%)
2,176
585
2,761
$16,521
9,481
$15,378
$1,111
$357
$895
Q3A
$36.9
1.0
8.0
$45.9
10.2%
46.7
2.4
$1.5
3.3%
1.6
13.7
0.9
0.1
($14.6)
(31.8%)
1.0
0.8
1.1
($15.4)
(33.7%)
($15.4)
(0.0)
0.8
0.9
($13.7)
(29.9%)
2,181
838
3,019
$16,925
9,534
$15,189
$697
$396
$745
Q4A
$22.6
0.5
4.2
$27.4
(12.6%)
28.1
1.2
$0.5
1.7%
1.7
15.5
1.0
4.2
($13.6)
(49.6%)
1.1
0.4
1.1
($14.0)
(51.3%)
($14.0)
0.1
0.4
1.0
($12.5)
(45.8%)
1,416
474
1,890
$15,983
8,851
$14,472
$336
$341
$1,200
Q1A
$21.9
0.7
7.4
$30.0
(40.8%)
26.6
0.2
$3.5
11.7%
1.8
11.3
1.0
(0.0)
($10.6)
(35.5%)
1.2
0.3
1.1
($11.1)
(37.1%)
($11.1)
0.2
0.3
1.0
($9.7)
(32.2%)
1,421
706
2,127
$15,423
10,417
$14,082
$2,465
$342
$1,257
Q2A
2020
$27.5
1.2
3.8
$32.4
(23.6%)
28.9
0.2
$3.7
11.5%
2.9
11.0
1.1
($11.3)
(34.9%)
6.8
0.7
6.7
($12.1)
(37.4%)
($12.1)
0.1
0.7
1.1
($10.2)
(31.5%)
1,822
474
2,296
$15,076
7,928
$14,129
$2,048
$258
$1,603
Q3EA
$47.7-$48.3
$2.1-$2.2
$8.8-$9.0
$58.7-$59.5
28.9%
54.8
$3.9
6.6%
3.9
11.7
1.2
($12.9)
(22.0%)
0.4
0.4
($13.7)
(23.3%)
($13.7)
0.4
0.4
1.2
($11.7)
(20.0%)
2,930-2,940
1,100
4,030-4,040
$16,463
10,710
$15,991
$1,318
$150
$1,339
Q4E
$59.4
3.1
9.5
$72.0
163.3%
67.9
$4.1
5.7%
6.5
13.1
1.4
($16.8)
(23.4%)
0.5
0.4
($17.7)
(24.6%)
($17.7)
0.5
0.4
1.4
($15.5)
(21.5%)
3,615
924
4,539
$16,442
10,260
$15,866
$1,139
$150
$1,794
2018A
$122.9
2.6
6.3
$131.8
39.4%
126.4
$5.4
4.1%
5.4
39.1
2.5
1.7
($40.0)
(30.3%)
3.0
0.2
3.1
($40.1)
(30.4%)
OS
($40.1)
(0.1)
0.2
2.5
($37.4)
(28.4%)
7,232
1,248
8,480
$16,992
5,053
$15,544
$745
$235
$752
2019A
$135.3
3.2
27.8
$166.2
26.1%
168.0
8.5
$6.7
4.0%
7.0
63.2
3.2
13.1
($53.6)
(32.3%)
3.6
1.7
4.2
($54.7)
(32.9%)
($54.7)
(0.6)
1.7
3.2
($50.4)
(30.3%)
8,263
2,828
11,091
$16,371
9,833
$14,988
$811
$378
$842
2020E
$157.1
$7.5
$28.5
$193.1
16.1%
178.2
0.3
$15.2
7.9%
15.1
47.1
4.6
(0.0)
($51.7)
(26.8%)
8.9
1.8
7.8
($54.7)
(28.3%)
($54.7)
1.2
1.8
4.6
($47.1)
(24.4%)
9,789
2,842
12,631
$16,046
10,027
$15,286
$1,554
$198
$1,544
2021E
$348.0
19.6
34.3
$401.8
108.1%
364.7
$37.1
9.2%
30.0
60.9
6.5
($60.2)
(15.0%)
2.5
1.8
($64.5)
(16.1%)
($64.5)
2.5
1.8
6.5
($53.7)
(13.4%)
20,921
3,365
24,286
$16,633
10,183
$16,546
$1,774
$150
$1,433
¹YOY Growth for Q3A 2020 calculated by the midpoint of the range ²Ecommerce average selling price calculated as ecommerce vehicle sales divided by ecommerce units
3Adjusted gross profit per unit calculated as adjusted gross profit divided by ecommerce units "Impact of non-repair labor expense per unit calculated as non-repair labor expense divided by ecommerce units
5Customer acquisition cost (CAC) per unit calculated as marketing expense divided by ecommerce units Estimated Actual (EA) defined as the range of achieved actual results.
Note: Adjusted gross profit includes total adjustments of cost of goods sold of $8.5MM in 2019A and $0.3MM in 2020E. Operating Profit includes total adjustments of $1.9MM in 2018A, $23.2MM in 2019A, $2.1MM in 2020E and $1.8MM in 2021E, and Net Income
(Loss) includes total adjustments of $4.8MM in 2018A, $25.7MM in 2019A, and $8.1MM in 2020E. For a reconciliation of adjusted gross margin and operating profit and net income (loss) to their most directly comparable GAAP financial measures see page 44 of
the presentation. Adjustments are attributable to non-cash expenses, largely related to Lithia warrant milestones, including $8.5 million of contra-revenue in 2019. These projections are for illustrative purposes only and should not be relied upon as being 43
necessarily indicative of future results. Projections that are considered non-GAAP financial measures are presented on a non-GAAP basis without reconciliations of such forward-looking non-GAAP measures due to the inherent difficulty in forecasting and
quantifying certain amounts that are necessary for such reconciliation. All historical annual GAAP financials shown are audited; quarterly, non-GAAP financials and projections are unaudited. Quarterly numbers are not shown under SAS 100 guidelines.View entire presentation