Palantir IPO Presentation Deck slide image

Palantir IPO Presentation Deck

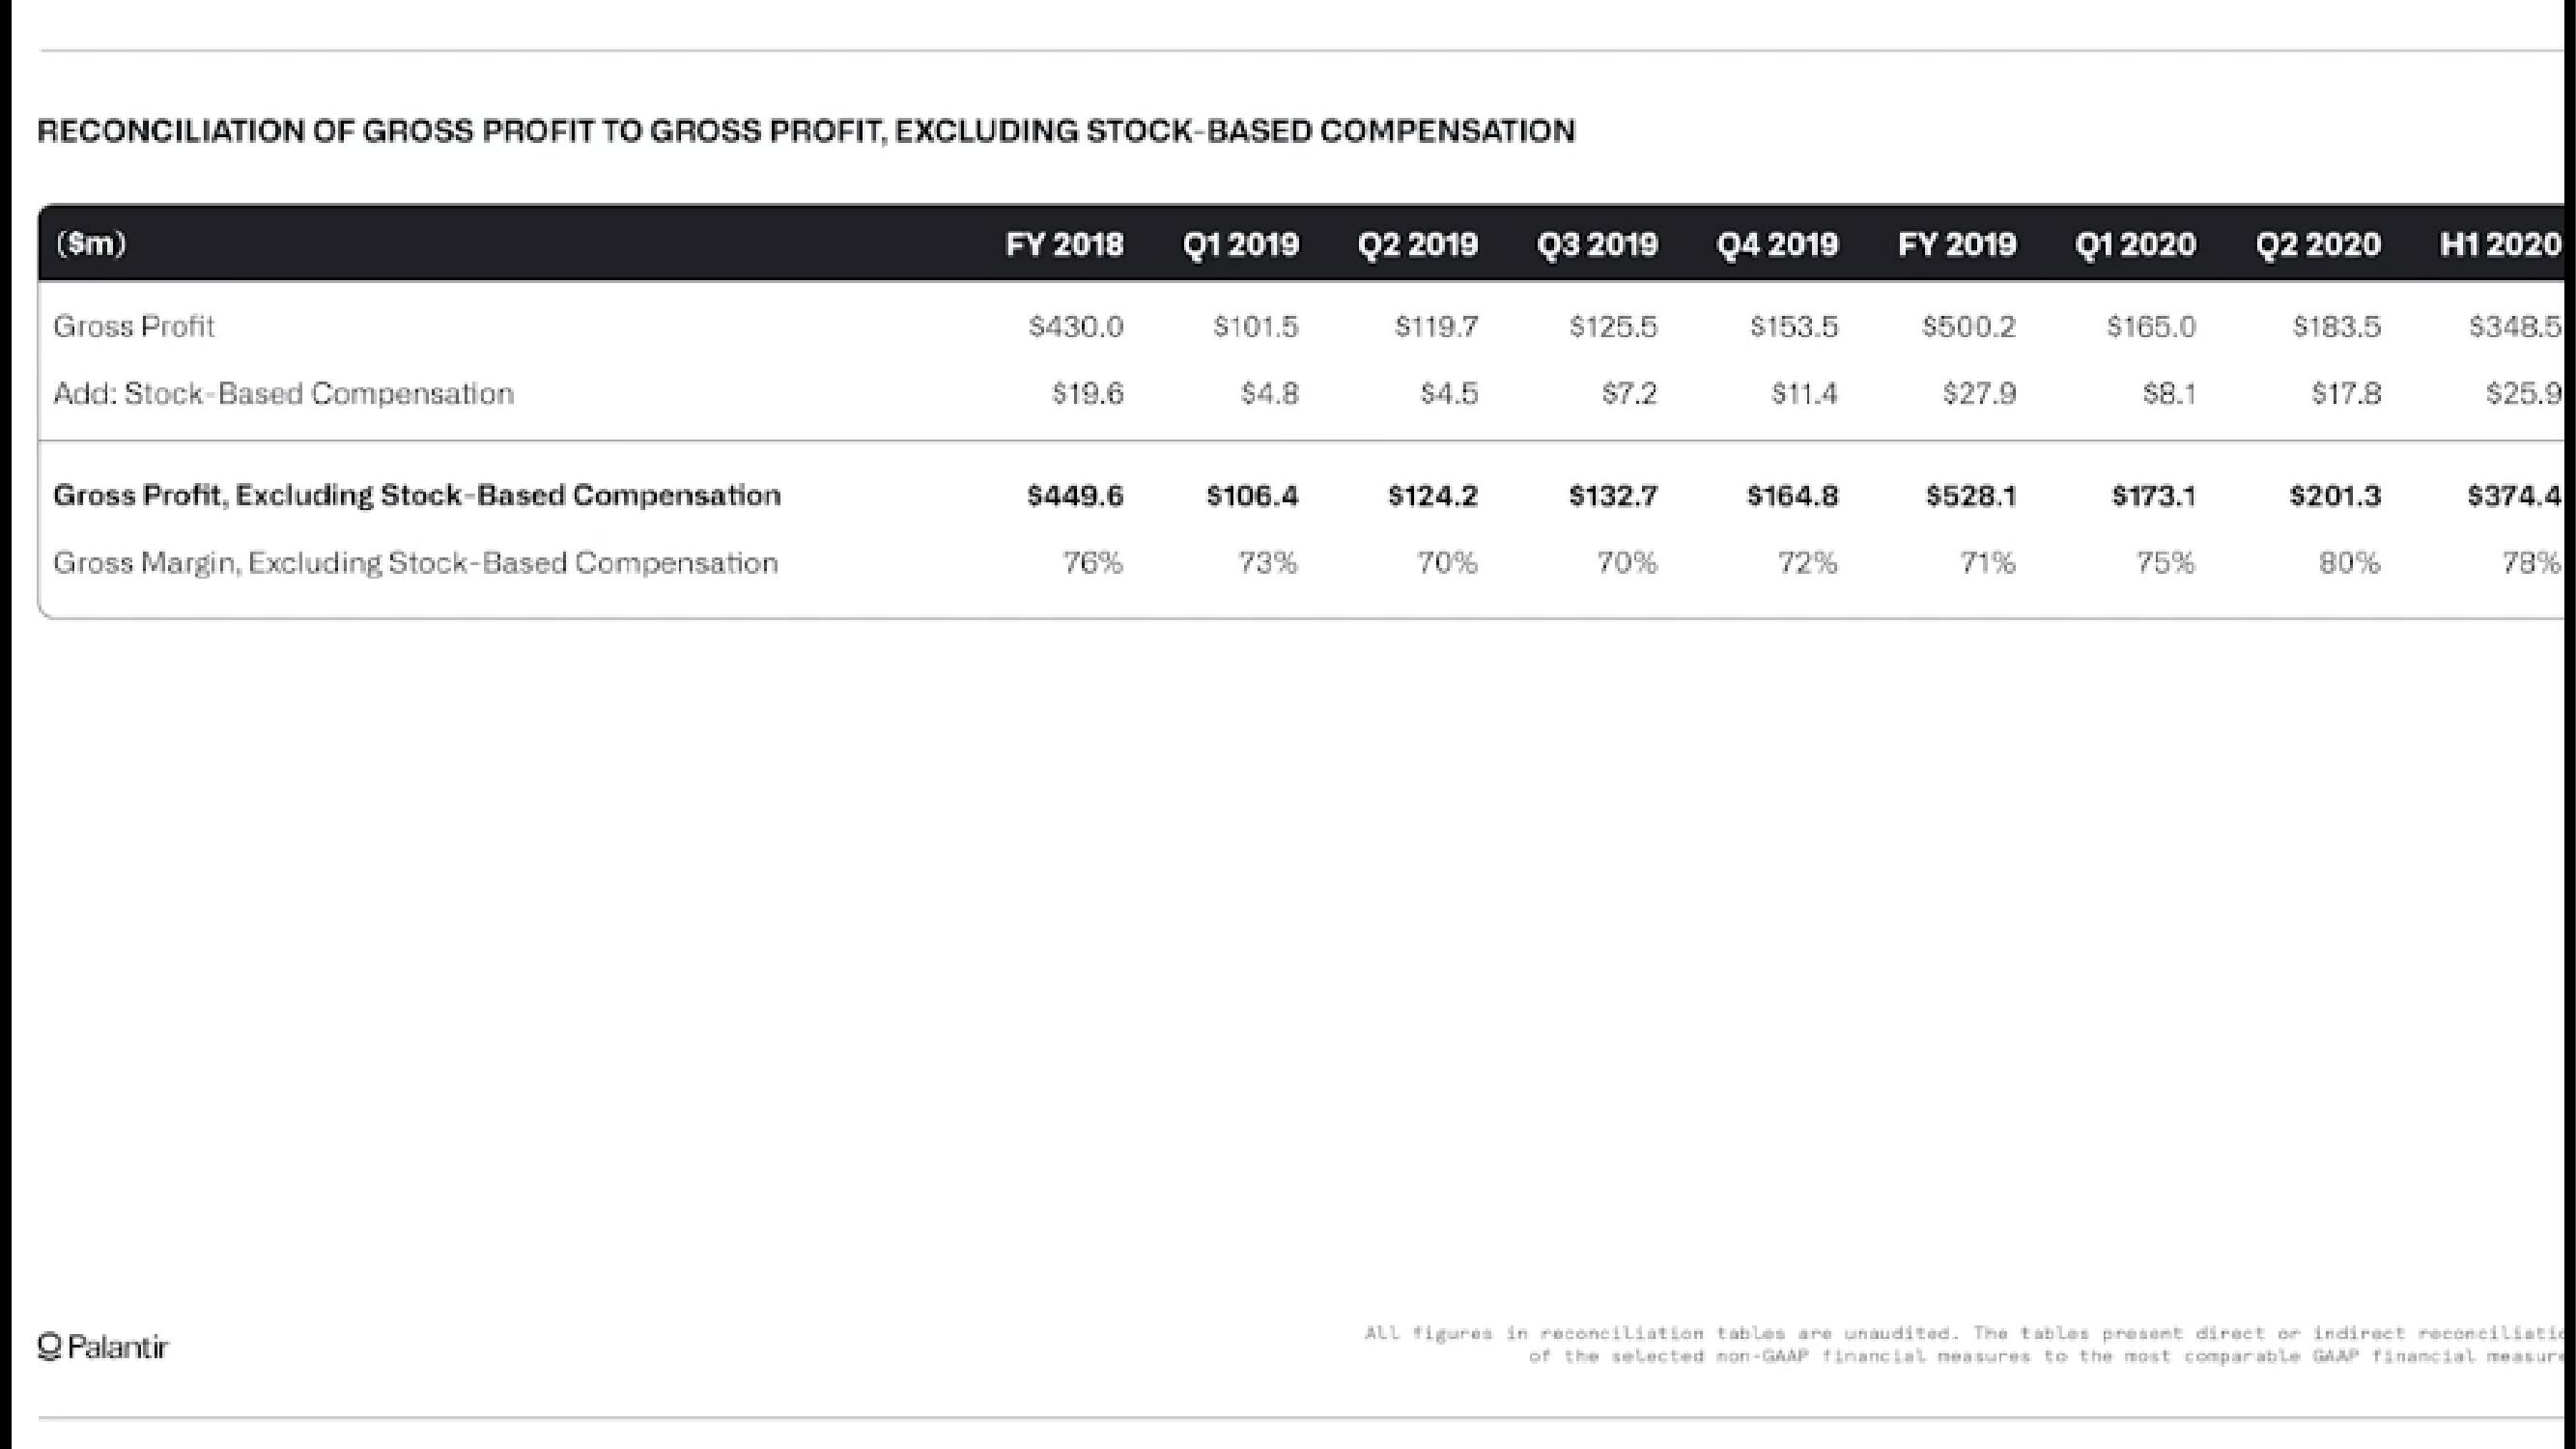
RECONCILIATION OF GROSS PROFIT TO GROSS PROFIT, EXCLUDING STOCK-BASED COMPENSATION ($m) Gross Profit Add: Stock-Based Compensation Gross Profit, Excluding Stock-Based Compensation Gross Margin, Excluding Stock-Based Compensation Q Palantir FY 2018 $430.0 $19.6 $449.6 76% Q1 2019 $101.5 $106.4 73% Q2 2019 $119.7 $124.2 70% Q3 2019 $125.5 $132.7 70% Q4 2019 $153.5 $11.4 $164.8 72% FY 2019 $500.2 $27.9 $528.1 71% Q1 2020 $165.0 $8.1 $173.1 75% Q2 2020 $183.5 $17.8 $201.3 HiEDEd $348.5 $374.4 ALL figures in reconciliation tables are unaudited. The tables present direct or indirect reconciliatio of the selected non-GAAP financial measures to the most comparable GAAP Tinancial measure
View entire presentation