Evercore Investment Banking Pitch Book
Preliminary Valuation of SIRE Common Units
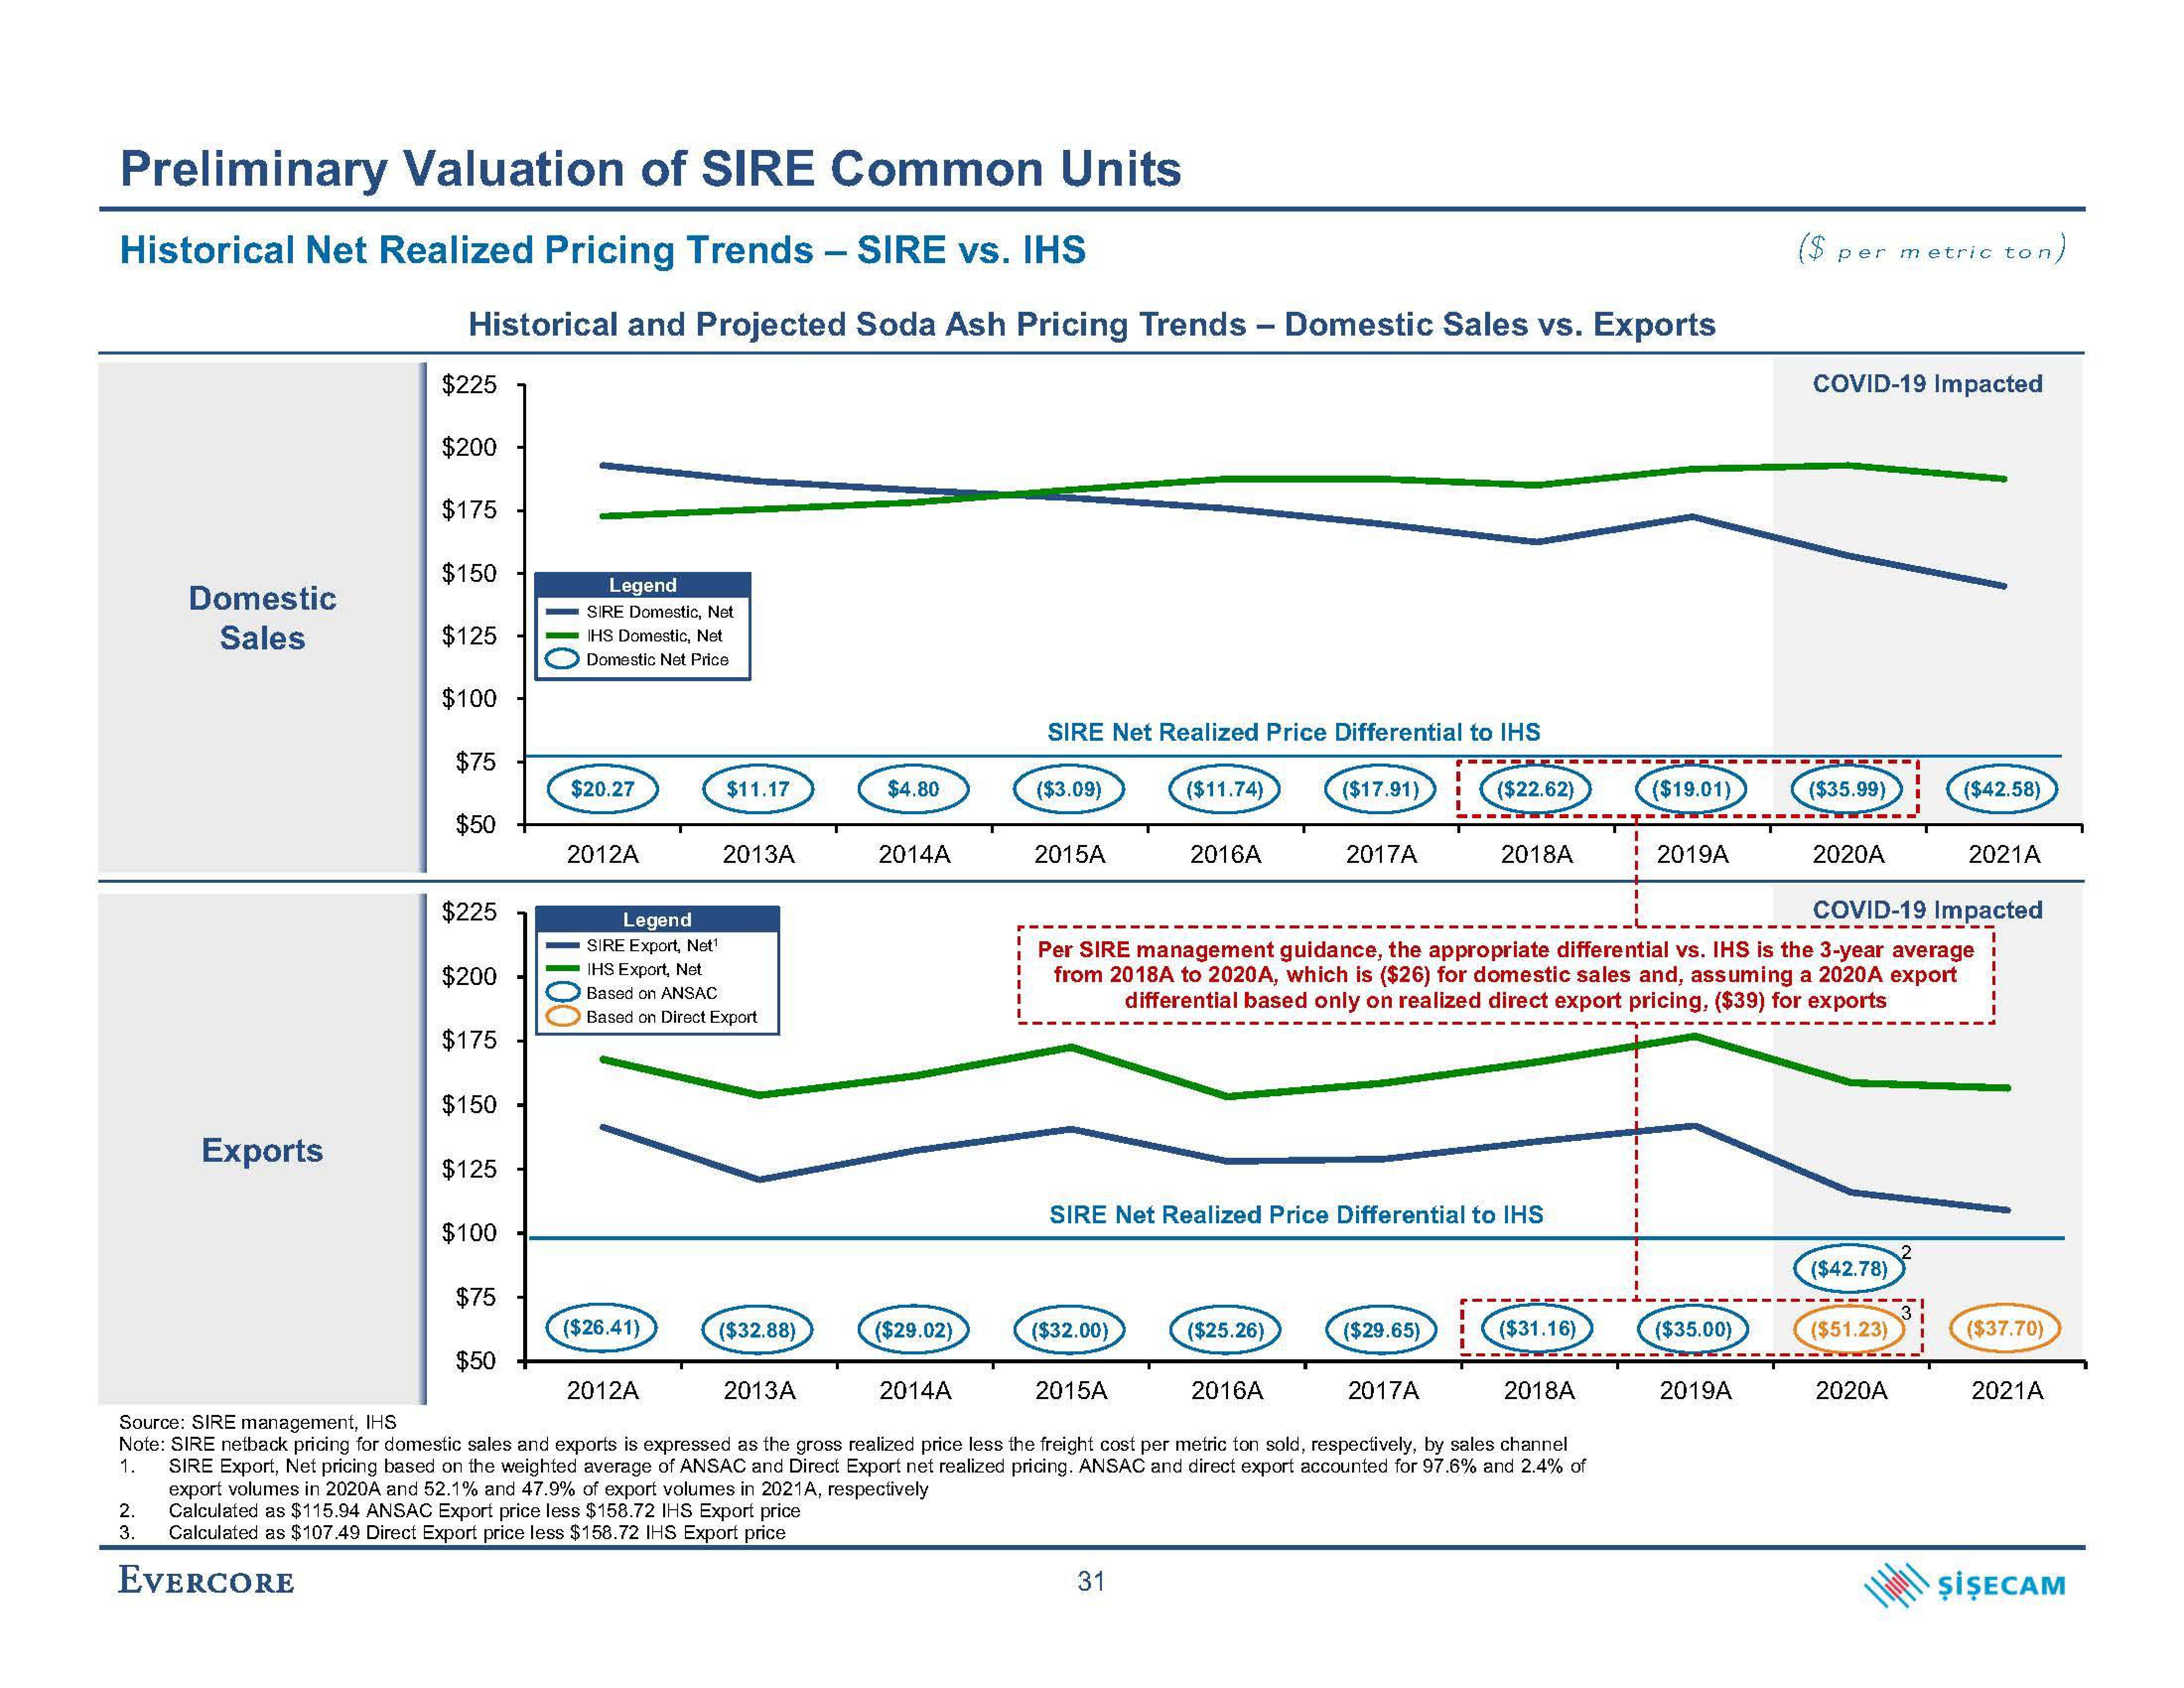
Historical Net Realized Pricing Trends - SIRE vs. IHS
Domestic
Sales
Exports
Historical and Projected Soda Ash Pricing Trends - Domestic Sales vs. Exports
$225
$200
$175
$150
$125
$100
$75
$50
$225
$200
$175
$150
$125
$100
$75
$50
Legend
SIRE Domestic, Net
IHS Domestic, Net
Domestic Net Price
$20.27
2012A
Legend
SIRE Export, Net¹
($26.41)
$11.17
IHS Export, Net
Based on ANSAC
Based on Direct Export
2013A
2012A
($32.88)
$4.80
2013A
2014A
($29.02)
SIRE Net Realized Price Differential to IHS
2014A
($3.09)
2015A
($11.74)
($32.00)
2016A
31
($17.91)
($25.26)
2021A
COVID-19 Impacted
Per SIRE management guidance, the appropriate differential vs. IHS is the 3-year average
from 2018A to 2020A, which is ($26) for domestic sales and, assuming a 2020A export
differential based only on realized direct export pricing, ($39) for exports
SIRE Net Realized Price Differential to IHS
2017A
2016A
($22.62)
2015A
2017A
2018A
Source: SIRE management, IHS
Note: SIRE netback pricing for domestic sales and exports is expressed as the gross realized price less the freight cost per metric ton sold, respectively, by sales channel
1. SIRE Export, Net pricing based on the weighted average of ANSAC and Direct Export net realized pricing. ANSAC and direct export accounted for 97.6% and 2.4% of
export volumes in 2020A and 52.1% and 47.9% of export volumes in 2021A, respectively
2. Calculated as $115.94 ANSAC Export price less $158.72 IHS Export price
3.
Calculated as $107.49 Direct Export price less $158.72 IHS Export price
EVERCORE
($29.65)
2018A
($31.16)
($19.01)
2019A
($35.00)
per metric ton)
2019A
COVID-19 Impacted
($35.99)
2020A
($42.78)
($51.23)
($42.58)
2020A
($37.70)
2021A
ŞİŞECAMView entire presentation