Ciena Corporation Earnings Presentation
1,000.0
800.0
600.0
400.0
200.0
0.0
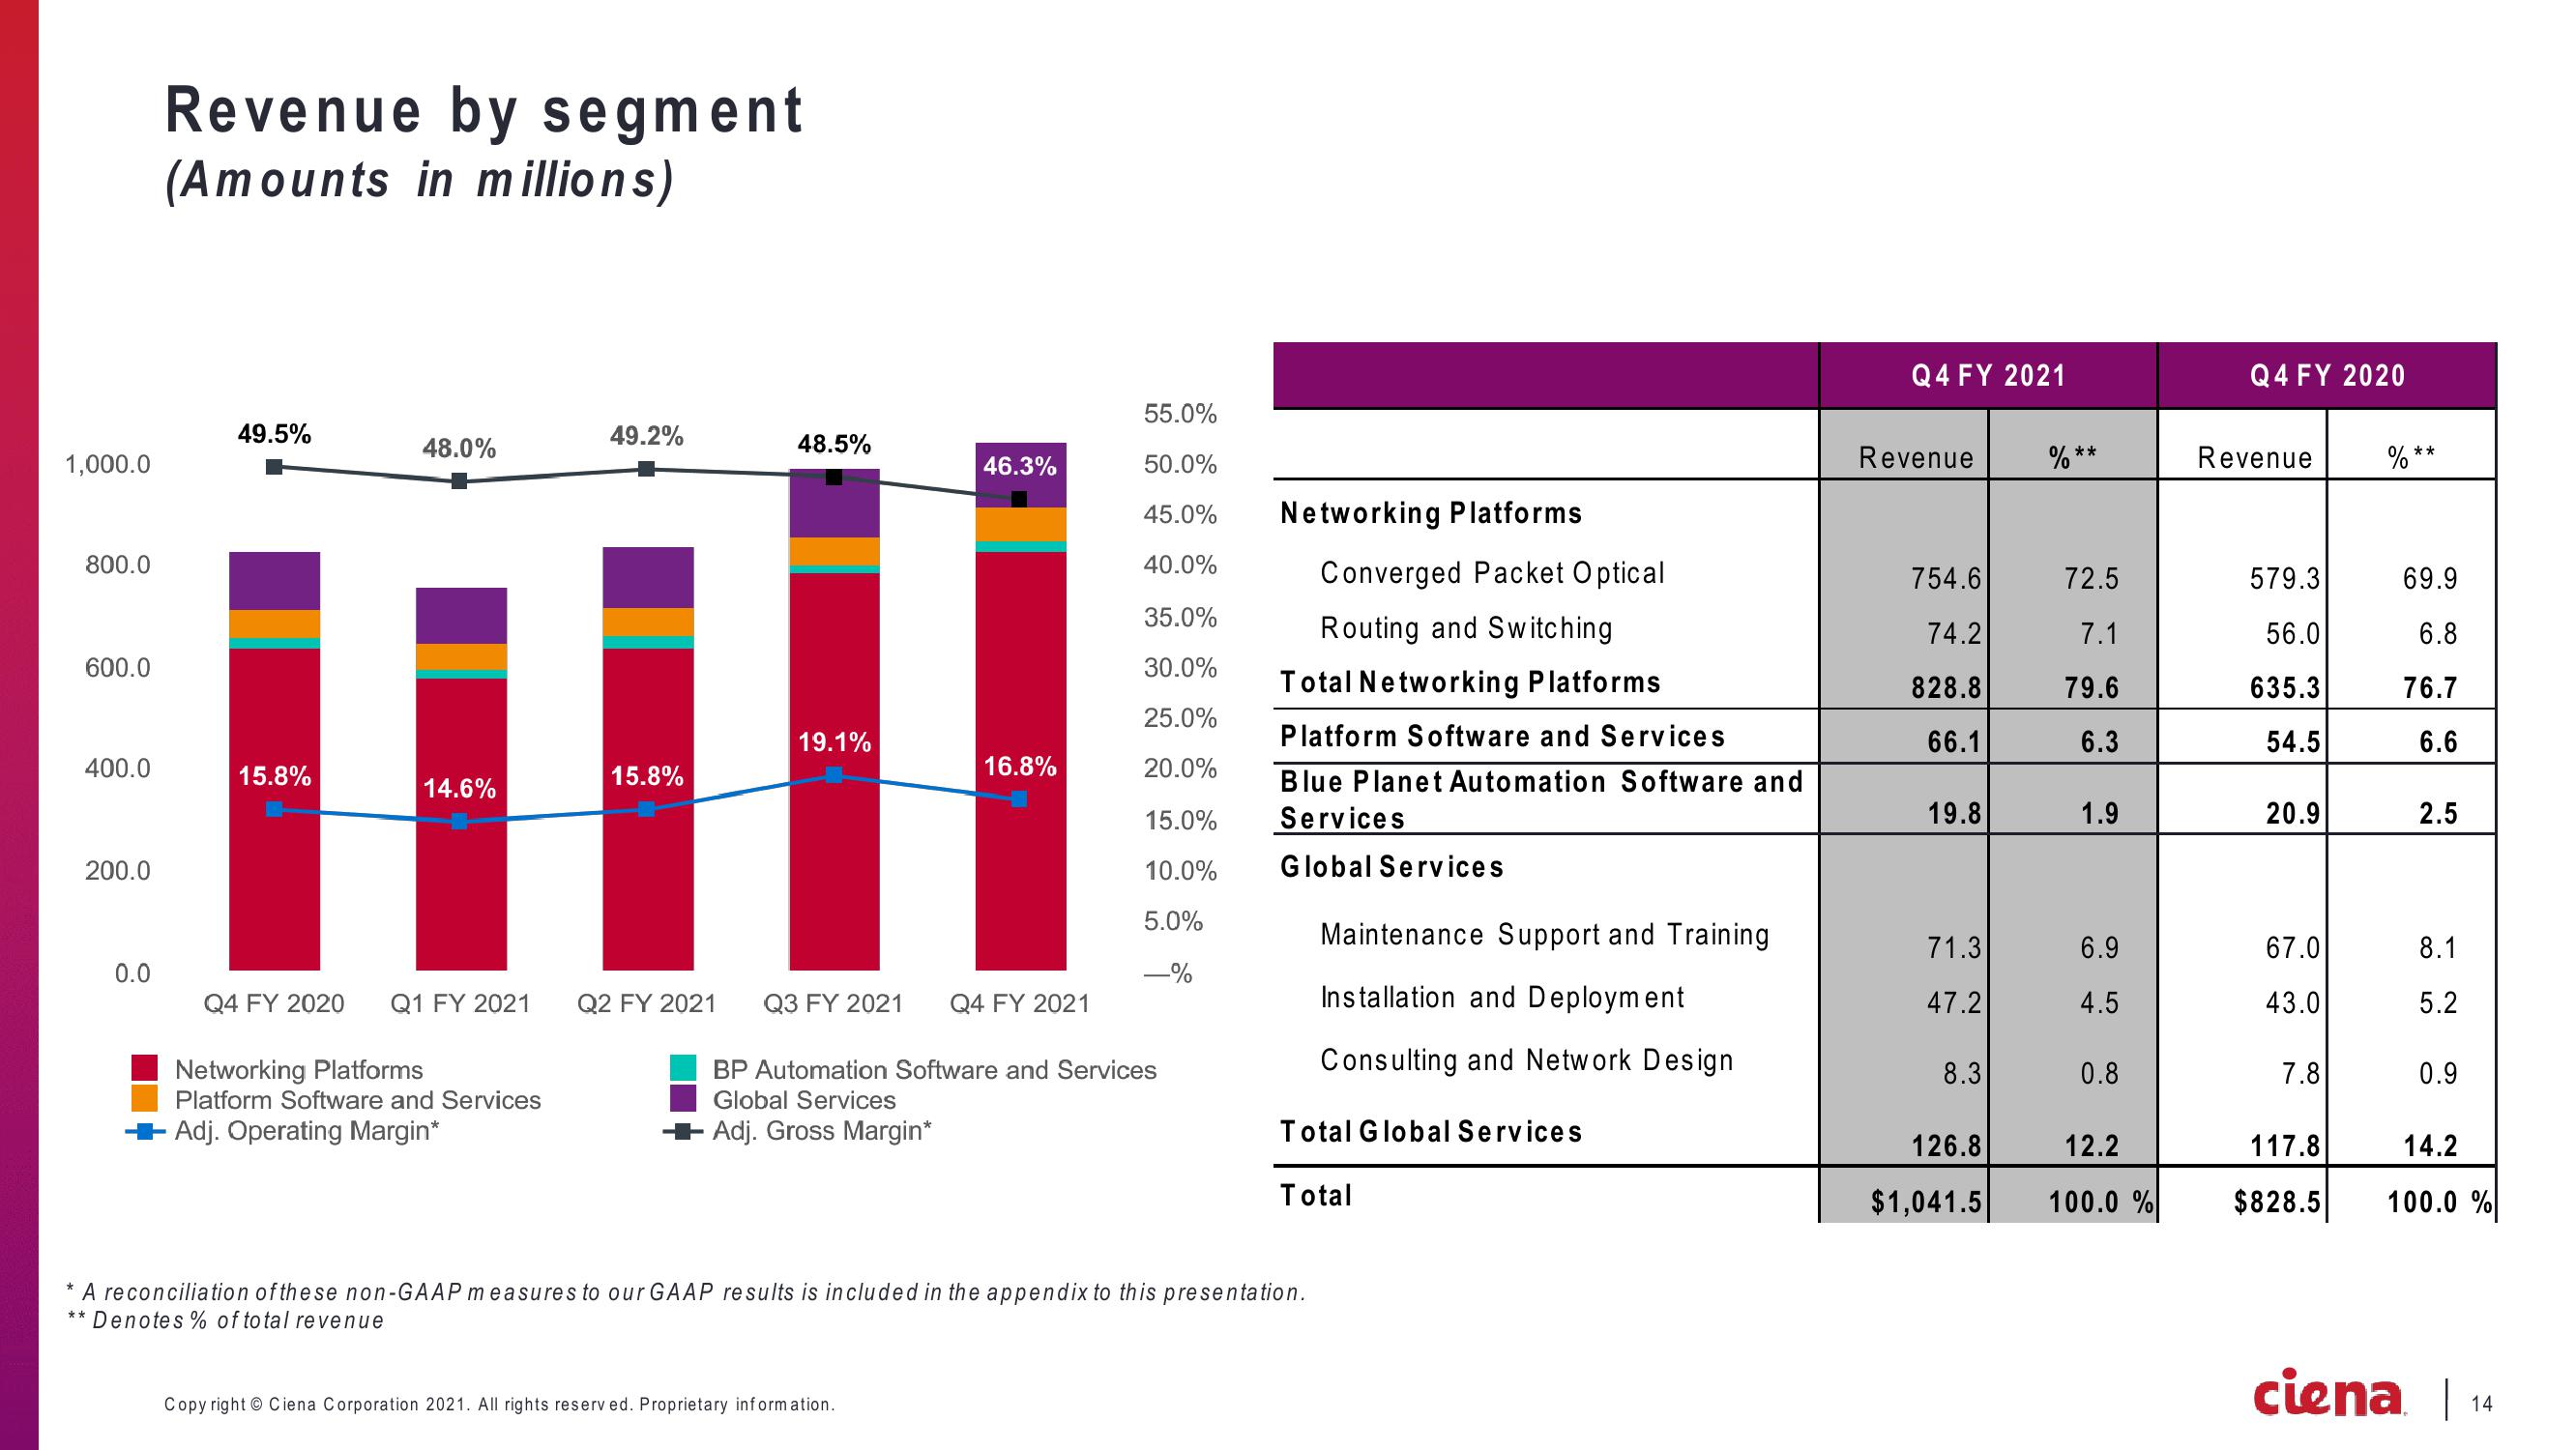
Revenue by segment
(Amounts in millions)
49.5%
15.8%
48.0%
14.6%
Q4 FY 2020 Q1 FY 2021
Networking Platforms
Platform Software and Services
Adj. Operating Margin*
49.2%
15.8%
48.5%
19.1%
46.3%
Q2 FY 2021 Q3 FY 2021 Q4 FY 2021
-Adj. Gross Margin*
16.8%
BP Automation Software and Services
Global Services
Copyright © Ciena Corporation 2021. All rights reserved. Proprietary information.
55.0%
50.0%
45.0%
40.0%
35.0%
30.0%
25.0%
20.0%
15.0%
10.0%
5.0%
-%
Networking Platforms
Converged Packet Optical
Routing and Switching
Total Networking Platforms
Platform Software and Services
Blue Planet Automation Software and
Services
Global Services
A reconciliation of the se non-GAAP measures to our GAAP results is included in the appendix to this presentation.
** Denotes % of total revenue
Maintenance Support and Training
Installation and Deployment
Consulting and Network Design
Total Global Services
Total
Q4 FY 2021
Revenue
754.6
74.2
828.8
66.1
19.8
71.3
47.2
8.3
126.8
$1,041.5
%**
72.5
7.1
79.6
6.3
1.9
6.9
4.5
0.8
12.2
100.0%
Q4 FY 2020
Revenue
579.3
56.0
635.3
54.5
20.9
67.0
43.0
7.8
117.8
$828.5
%
**
69.9
6.8
76.7
6.6
2.5
8.1
5.2
0.9
14.2
100.0%
ciena | 14View entire presentation