Datadog Investor Presentation Deck
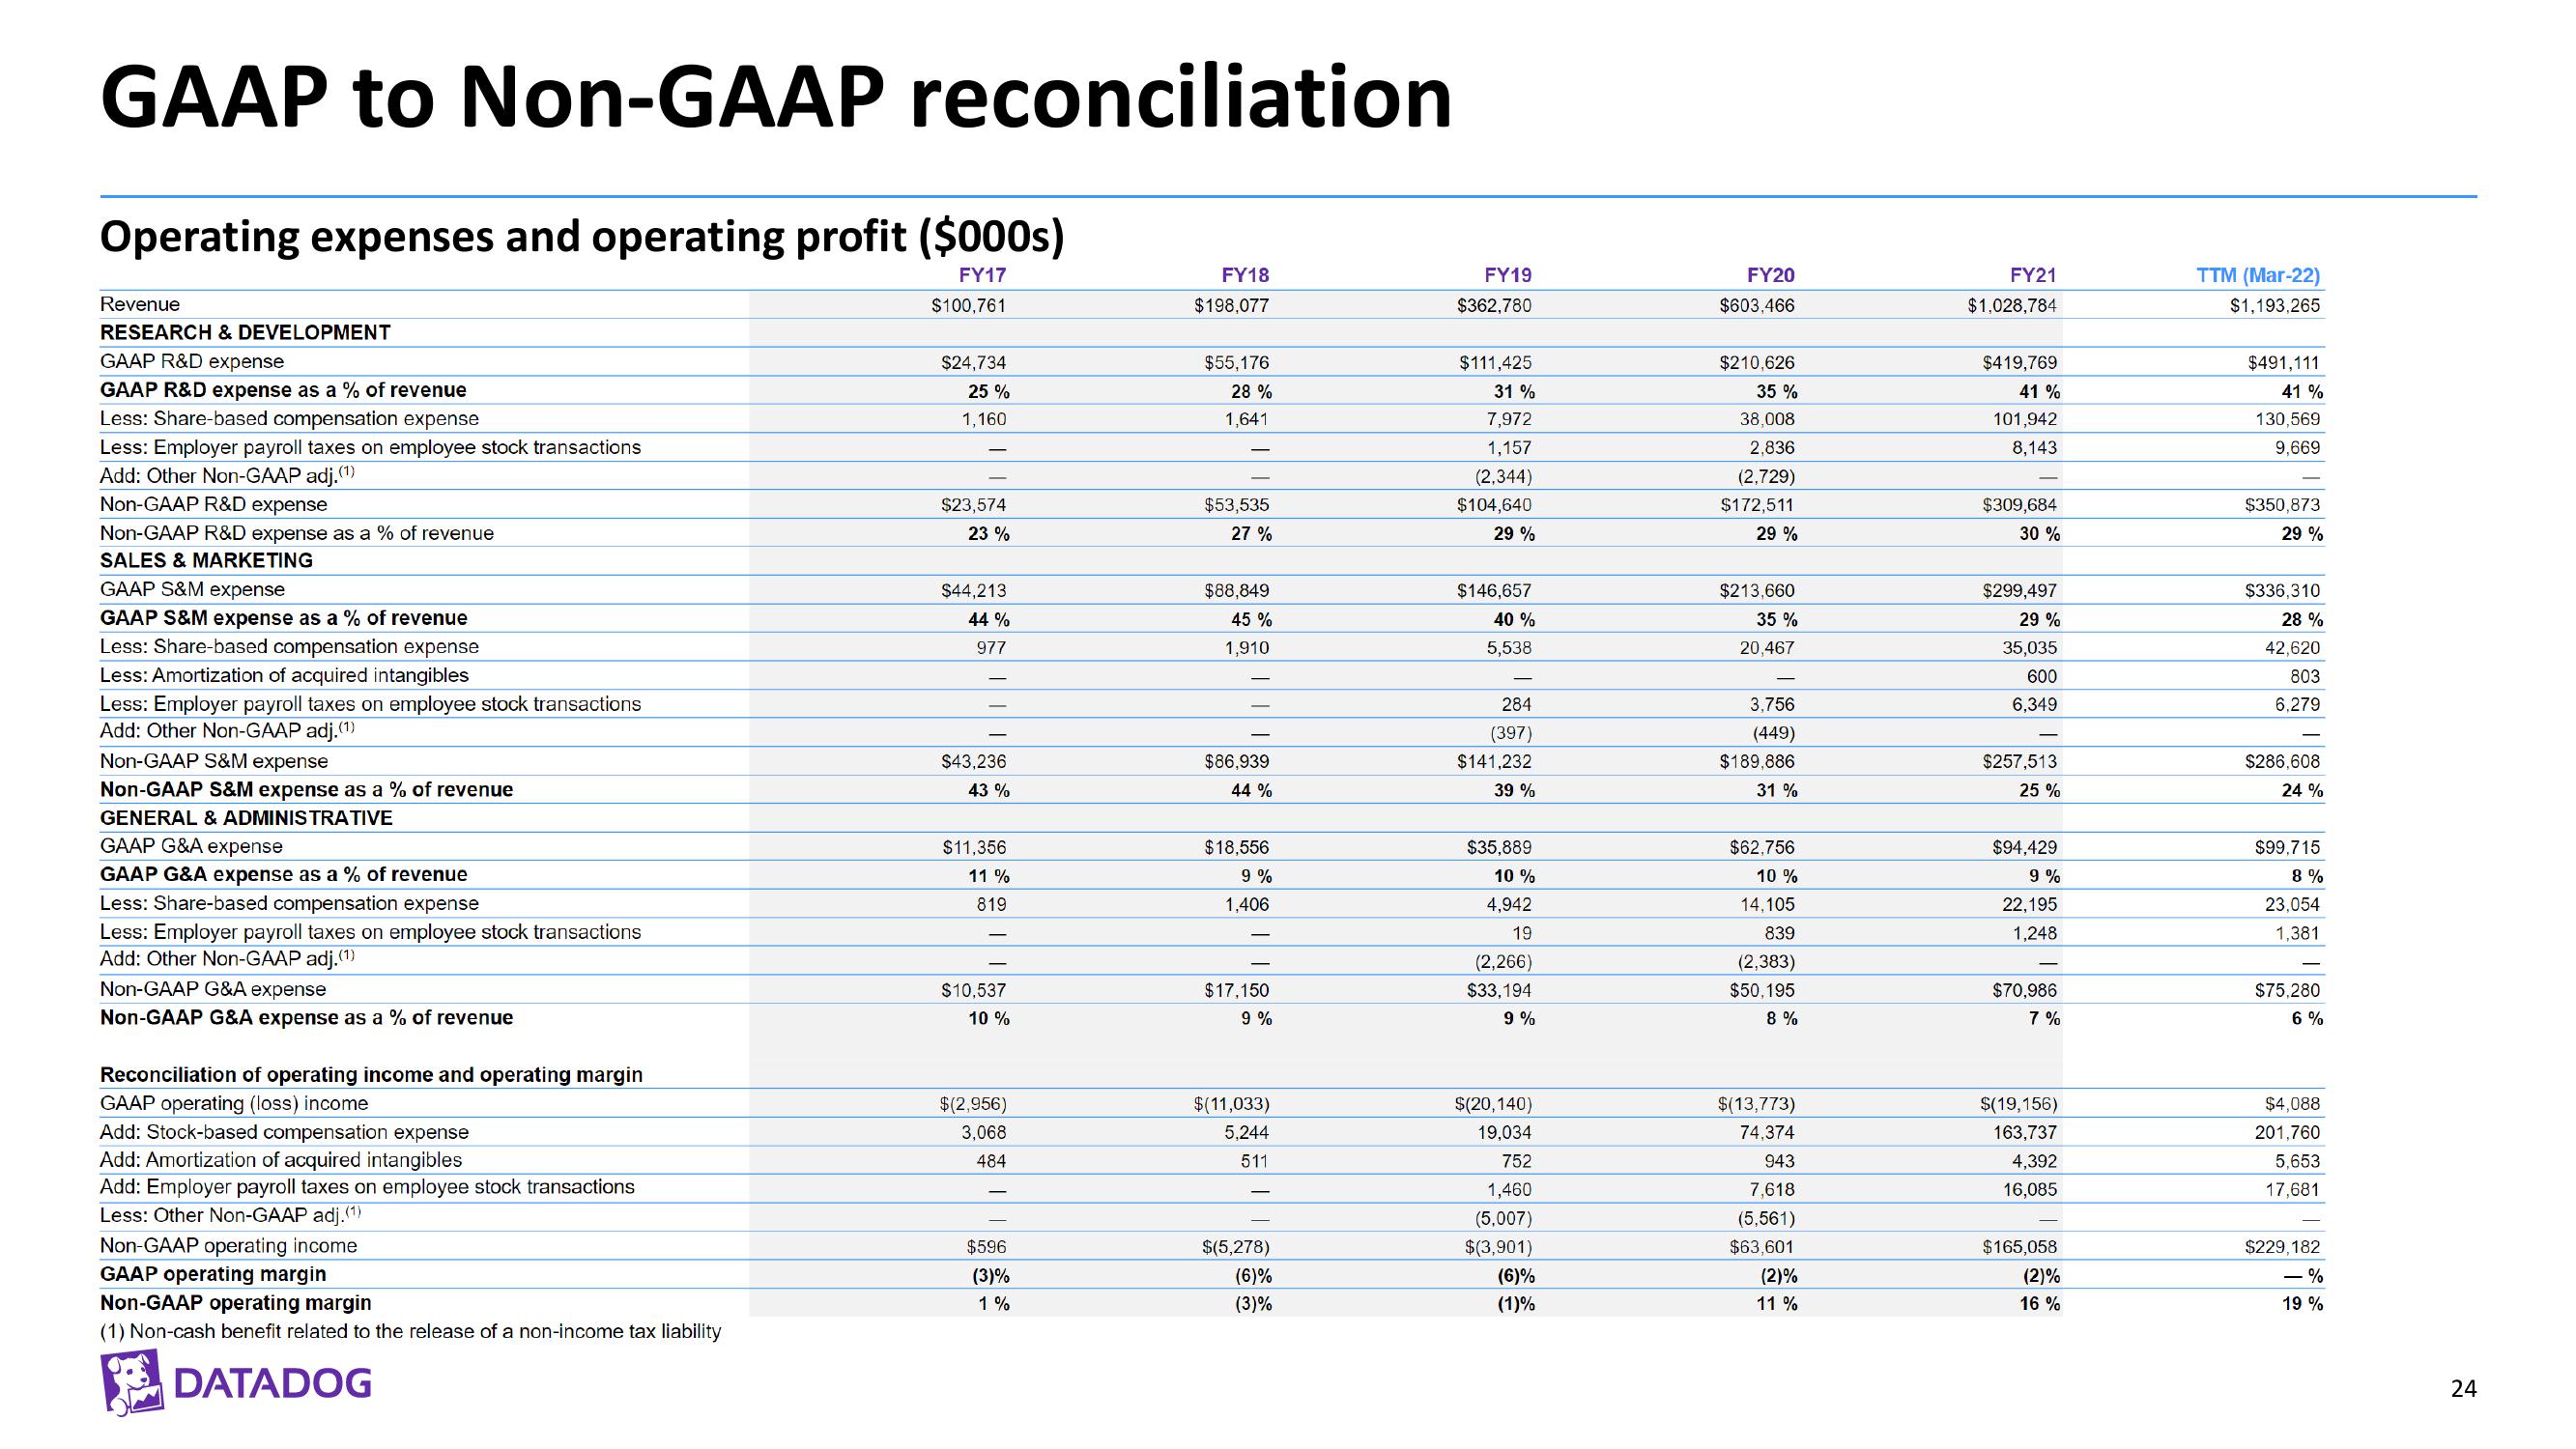
GAAP to Non-GAAP reconciliation
Operating expenses and operating profit ($000s)
FY17
$100,761
Revenue
RESEARCH & DEVELOPMENT
GAAP R&D expense
GAAP R&D expense as a % of revenue
Less: Share-based compensation expense
Less: Employer payroll taxes on employee stock Insactions
Add: Other Non-GAAP adj.(1¹)
Non-GAAP R&D expense
Non-GAAP R&D expense as a % of revenue
SALES & MARKETING
GAAP S&M expense
GAAP S&M expense as a % of revenue
Less: Share-based compensation expense
Less: Amortization of acquired intangibles
Less: Employer payroll taxes on employee stock transactions
Add: Other Non-GAAP adj. (1)
Non-GAAP S&M expense
Non-GAAP S&M expense as a % of revenue
GENERAL & ADMINISTRATIVE
GAAP G&A expense
GAAP G&A expense as a % of revenue
Less: Share-based compensation expense
Less: Employer payroll taxes on employee stock transactions
Add: Other Non-GAAP adj. (1)
Non-GAAP G&A expense
Non-GAAP G&A expense as a % of revenue
Reconciliation of operating income and operating margin
GAAP operating (loss) income
Add: Stock-based compensation expense
Add: Amortization of acquired intangibles
Add: Employer payroll taxes on employee stock transactions
Less: Other Non-GAAP adj. (1)
Non-GAAP operating income
GAAP operating margin
Non-GAAP operating margin
(1) Non-cash benefit related to the release of a non-income tax liability
DATADOG
$24,734
25%
1,160
$23,574
23 %
$44,213
44%
977
$43,236
43%
$11,356
11%
819
$10,537
10%
$(2,956)
3,068
484
$596
(3)%
1%
FY18
$198,077
$55,176
28 %
1,641
$53,535
27%
$88,849
45 %
1,910
$86,939
44%
$18,556
9%
1,406
$17,150
9 %
$(11,033)
5,244
511
$(5,278)
(6)%
(3)%
FY19
$362,780
$111,425
31 %
7,972
1,157
(2,344)
$104,640
29%
$146,657
40 %
5,538
284
(397)
$141,232
39 %
$35,889
10%
4,942
19
(2,266)
$33,194
9%
$(20,140)
19,034
752
1,460
(5,007)
$(3,901)
(6)%
(1)%
FY20
$603,466
$210,626
35 %
38,008
2,836
(2,729)
$172,511
29 %
$213,660
35 %
20,467
3,756
(449)
$189,886
31%
$62,756
10 %
14,105
839
(2,383)
$50,195
8%
$(13,773)
74,374
943
7,618
(5,561)
$63,601
(2)%
11%
FY21
$1,028,784
$419,769
41 %
101,942
8,143
$309,684
30 %
$299,497
29%
35,035
600
6,349
$257,513
25 %
$94,429
9%
22,195
1,248
$70,986
7%
$(19,156)
163,737
4,392
16,085
$165,058
(2)%
16 %
TTM (Mar-22)
$1,193,265
$491,111
41%
130,569
9,669
$350,873
29 %
$336,310
28%
42,620
803
6,279
$286,608
24%
$99,715
8%
23,054
1,381
$75,280
6%
$4,088
201,760
5,653
17,681
$229,182
-%
19 %
24View entire presentation