PB Bankshares Results Presentation Deck
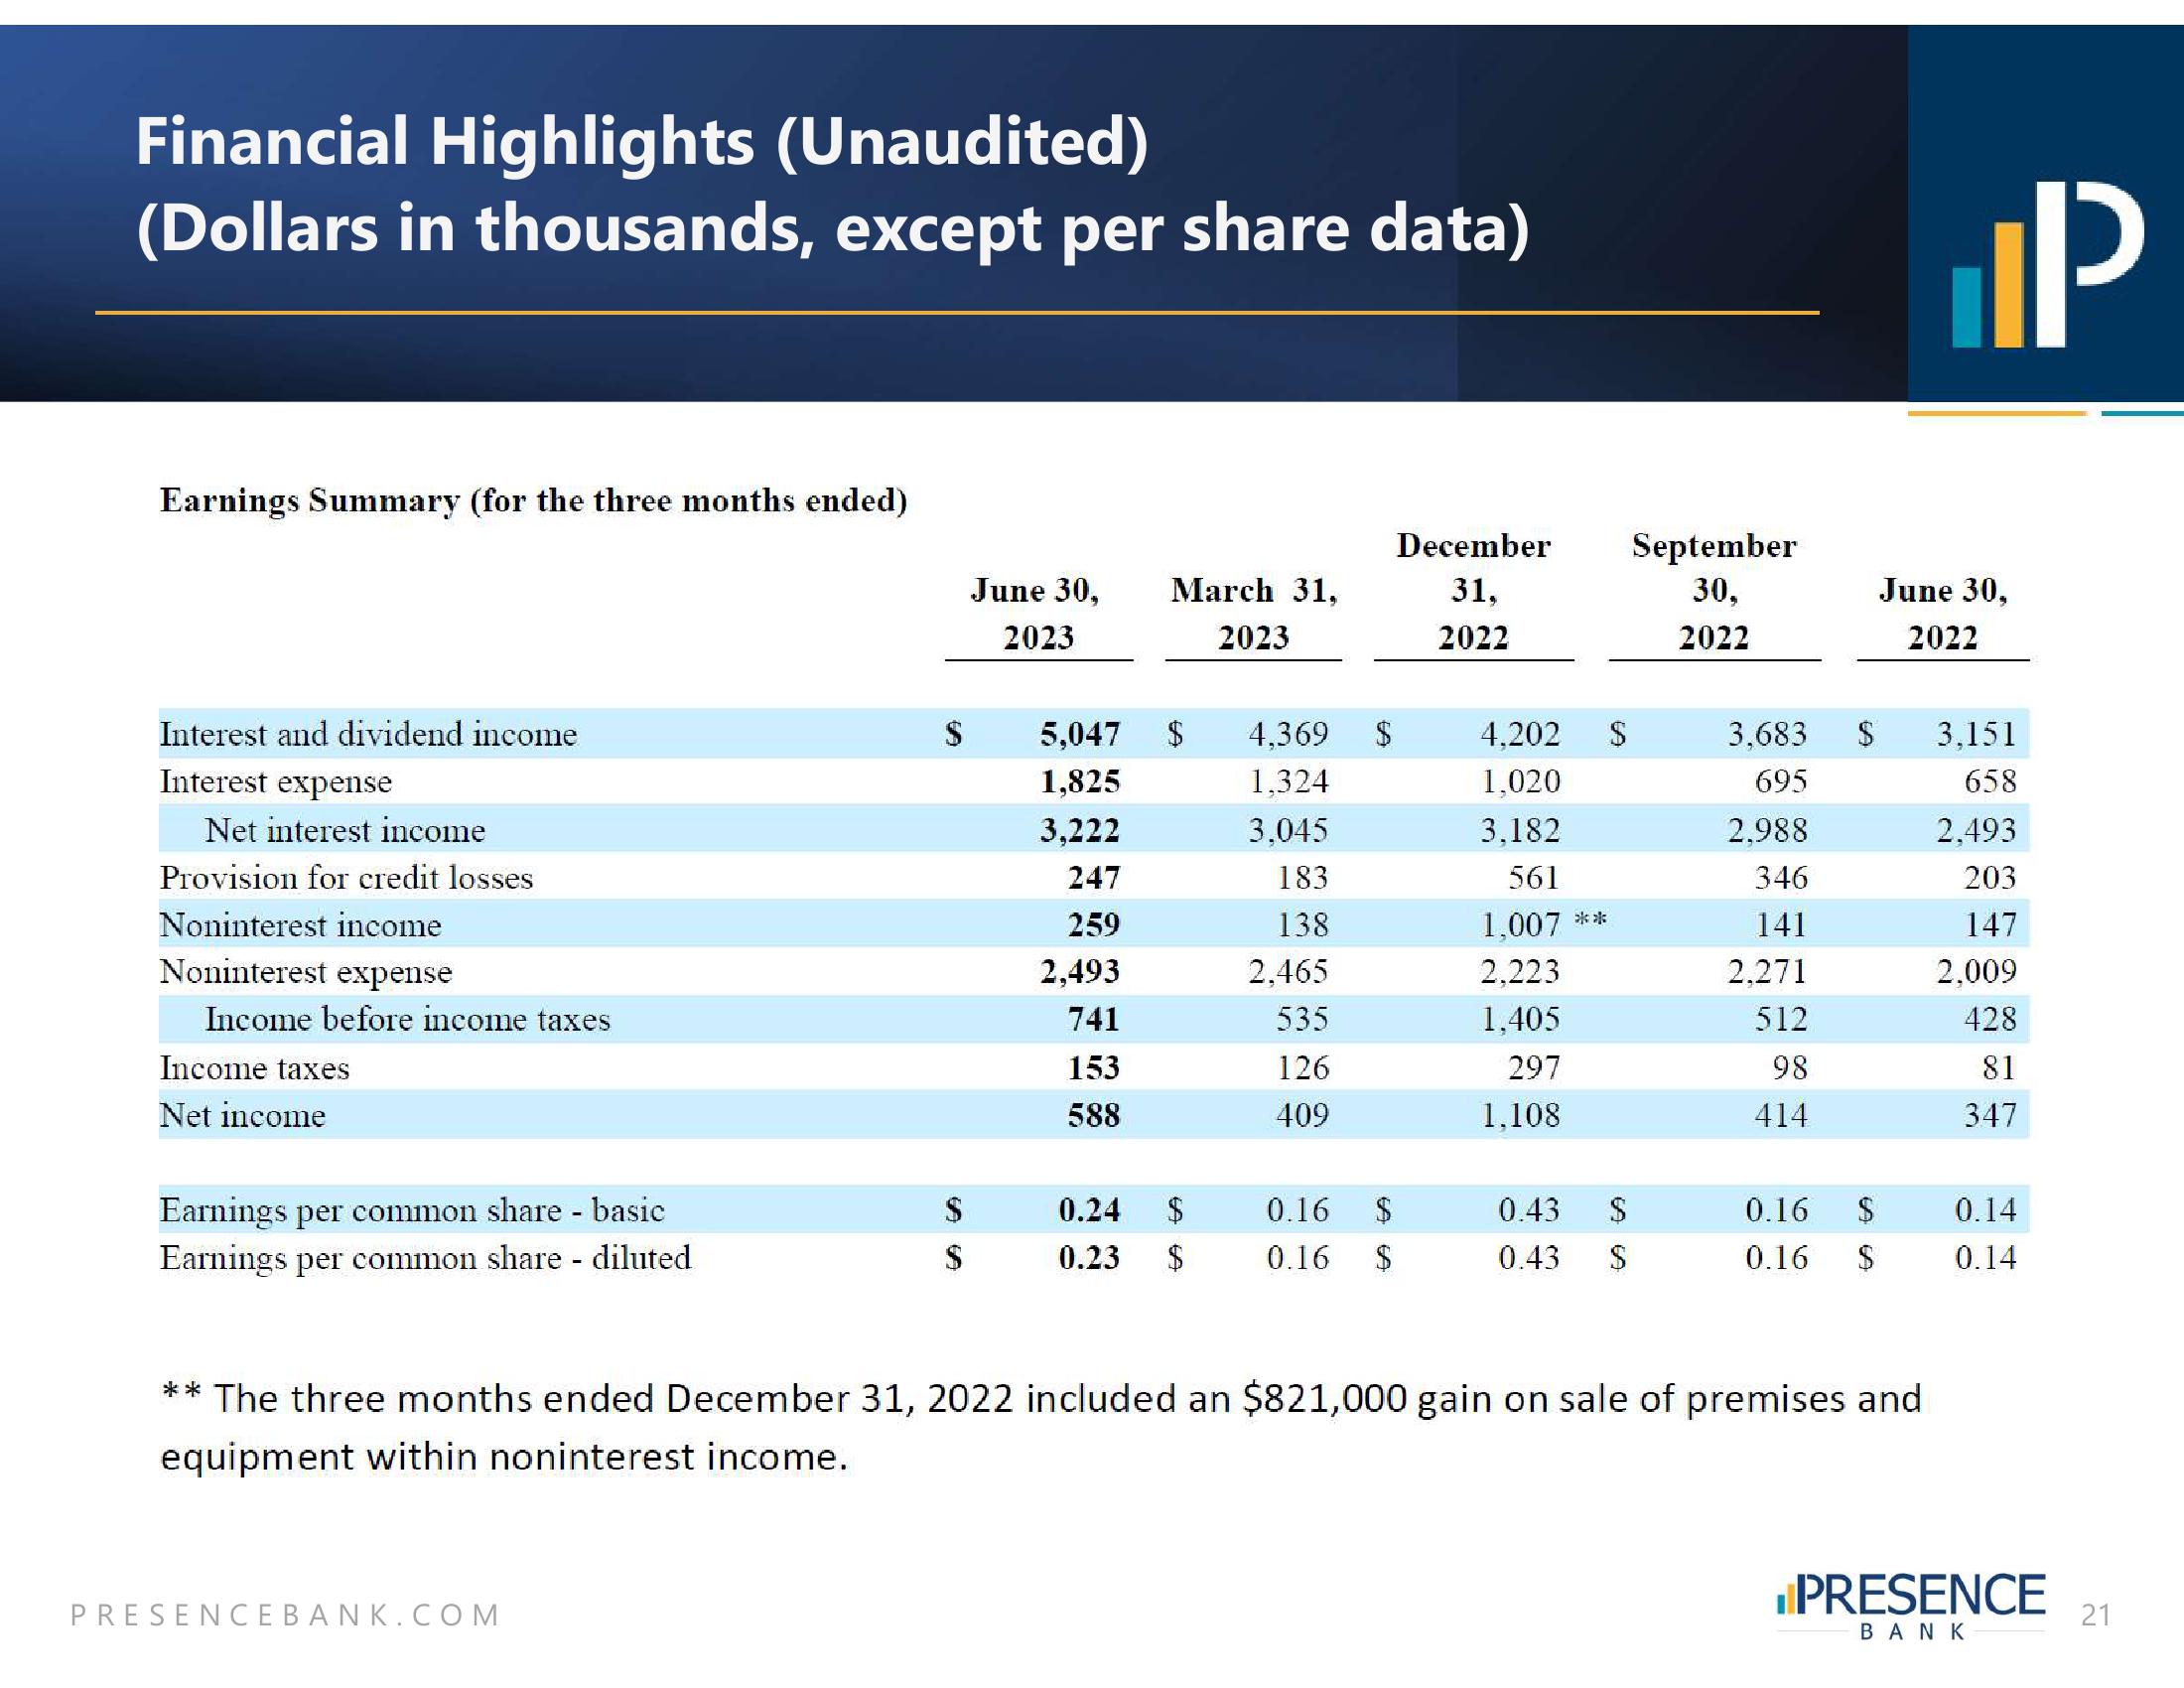
Financial Highlights (Unaudited)
(Dollars in thousands, except per share data)
Earnings Summary (for the three months ended)
Interest and dividend income
Interest expense
Net interest income
Provision for credit losses
Noninterest income
Noninterest expense
Income before income taxes
Income taxes
Net income
Earnings per common share - basic
Earnings per common share - diluted
June 30, March 31,
2023
2023
PRESENCEBANK.COM
5,047 $
1,825
3,222
247
259
2,493
741
153
588
0.24 $
0.23 $
4,369
1,324
3,045
183
138
2,465
535
126
409
$
0.16 $
0.16 $
December
31,
2022
4.202
1,020
3,182
561
1,007 **
2,223
1,405
297
1,108
$
0.43 $
0.43 $
September
30,
2022
3,683
695
2.988
346
141
2.271
512
98
414
$
$
0.16
0.16 $
** The three months ended December 31, 2022 included an $821,000 gain on sale of premises and
equipment within noninterest income.
כןן.
June 30,
2022
3,151
658
2,493
203
147
2,009
428
81
347
0.14
0.14
PRESENCE
ΒΑΝΚ
21View entire presentation